
Which Gravel Tire Is Actually Faster? Two Testers Settled It With Real Data
Skinny tire or wide tire. Slick or knobby. It's one of the oldest debates in gravel riding, and it usually gets settled by feel, a Strava segment, or whatever the fastest person in the group ride happens to be running.
Cycling journalist Ben Delaney and tire tester John Karish decided to settle it properly. Over two days on two very different Colorado gravel surfaces, they ran a controlled test comparing four tires, including two widths of the same Schwalbe RS Pro model and two versions of the Schwalbe Rick XC. Their protocol combined the Chung method (a way of calculating rolling resistance and drag from ride data instead of a lab) with real aerodynamic measurement, which is where AiRO came in. You can watch the full test here: Gravel Tire Testing: Skinny vs Wide, Slick vs Knobby.
Why Rolling Resistance Testing Needs Real Aero Data
The Chung method works by measuring everything it can, tire rollout, speed, power, air density, wind, and system weight, and solving for whatever's left unknown. To isolate rolling resistance accurately, you first have to account for aerodynamic drag. Guess wrong on CdA and the whole model skews, making a flat road look like it's sloping downhill or up.
That's the piece Karish used AiRO to solve. Rather than booking wind tunnel time, he and Delaney each ran their own rider photos through AiRO's platform, adjusting position details like elbow width, hand position, and helmet angle until the model matched their actual riding position. AiRO's CFD analysis then calculated each rider's CdA, giving them a real, individualized aero number to plug into the rest of the equation instead of an assumption.
Karish, who has published rolling resistance data on more than 70 tires, called it a way to get a wind tunnel number without a wind tunnel, and noted that AiRO's founder has validated the platform's output against wind tunnels directly, including work with Olympic speed skaters chasing hundredths of a second.
What They Found
The results depended entirely on the surface, which was the whole point.
On hard-packed, magnesium-chloride-treated dirt, a smoother, faster surface, the numbers came out close to even: both the 45mm and 55mm RS Pro tires required about 206 watts to hold 35 km/h once aerodynamics were factored in. The wider tire rolled slightly better, and the narrower one was slightly more aerodynamic, and the two effects canceled out.
On rough, loose gravel, the story flipped. The 45mm tire required 294 watts to hold that same speed. The 55mm version needed only 271 watts, a 23-watt savings, aerodynamics included. The knobbier Rick XC saved 16 watts over the 45mm tire on the same surface, but still came in behind the wider slick.
The takeaway wasn't "bigger is always better." It was that the right tire choice depends on the surface, and the margins are big enough to matter once you can actually measure them.
Why This Matters for Fitters and Riders
This test is a good example of what AiRO is built for: giving people outside a lab or a wind tunnel a real, individualized aerodynamic number they can use to answer a practical question. Karish and Delaney weren't AiRO customers running a sponsored test. They were independent testers who needed accurate rider CdA to make their own methodology work, and reached for the platform because it got them there without the cost or scheduling of a wind tunnel.
Watch the whole video here: Youtube. If you're a fitter curious about adding aerodynamic testing to your own studio, or a rider wondering what your own position is costing you, find an AiRO-approved fitter near you.
26 Seconds: Inside the Bike Fit That Helped a Comeback Cyclist Win a National Title
In November 2025, Guy Preston walked into the APEX Performance Center in Boulder, Colorado, with a clear goal: win the USA Cycling 60-64 men's individual time trial national championship in 2026.
It wasn't his first attempt. Guy had finished third at nationals in June 2025, racing back from being hit by a car in December 2024. By the time he booked his session with APEX, he was also recovering from a second crash that August. He came to Boulder for a 3D TT bike fit, an AiRO aerodynamics analysis, and a FUEL physiology test, hoping to close the gap between third place and the top of the podium.
Eight months later, he won by 26 seconds.
Finding the Watts That Were Already There
APEX coaches Jeff Hoobler and Neal Henderson led the fit. Jeff, who specializes in strength and movement assessment, evaluated Guy's physical capabilities while Neal measured his TT bike to establish a starting point. From there, the team combined Jeff's assessment, Guy's on-bike kinematics, and AiRO's aerodynamic simulation to map out where Guy's position was costing him speed.
UCI rules limited how far his position could change, but there was still room to work with. Guy's baseline came back at a CdA of .228, already a reasonably aero number. The problem was his physiology testing: he didn't have the raw power to out-muscle his competition at that drag number. He needed to get faster without producing more watts.
The fix came from two changes: extending his elbow and hand reach, and switching helmets. Together, they brought his CdA down to .201.
That 0.027 reduction works out to roughly 40 fewer watts required to hold the same speed. For a masters athlete without an unlimited power ceiling, that's not a marginal gain. It's the difference between racing for a podium and racing to win.
Fitting the Engine to the Aerodynamics
The FUEL test rounded out the picture. It showed Guy was highly efficient at burning fat for fuel and gave the team target heart rate, power, and perceived-effort zones to train by, adjusted for Boulder's altitude versus his sea-level racing. Guy left that first session having signed on for ongoing coaching with APEX.
The results compounded from there. In February, Guy opened his 2026 season with a time trial win and an overall general classification victory at the Valley of the Sun stage race in Arizona. He carried that form through a series of podiums and wins into the summer.
On June 29, 2026, at the USA Cycling Masters National Championships near Milwaukee, Wisconsin, Guy won the 60-64 men's individual time trial, a 22km (13.8 mile) course, in 29:20, 26 seconds ahead of second place.
One Story Among Several
Guy's result wasn't an outlier for APEX's 2026 season. The team also ran AiRO analysis for that year's junior and U23 men's time trial national champions, five other masters national champions across individual and team pursuit events, and the 17-18 men's junior national criterium champion.
A fit doesn't guarantee a title. But when a rider's aerodynamics, physiology, and coaching are all pointed in the same direction, the numbers tend to follow. Guy's CdA drop from .228 to .201 is the kind of gain that shows up on a stopwatch, not just a spec sheet, and it's exactly what AiRO's CFD-based aero analysis is built to find: real drag reductions a fitter can act on, without a wind tunnel.
This story draws on reporting from APEX Coaching, written by founder Neal Henderson, whose team has used AiRO's aerodynamic analysis platform since 2025. Read the article here: Apex Cycling If you're a fitter or coach interested in bringing wind tunnel-level aero data into your own studio, reach out to learn about becoming an AiRO partner.
Inflated Expectations: The Aero Data on Sports Bras
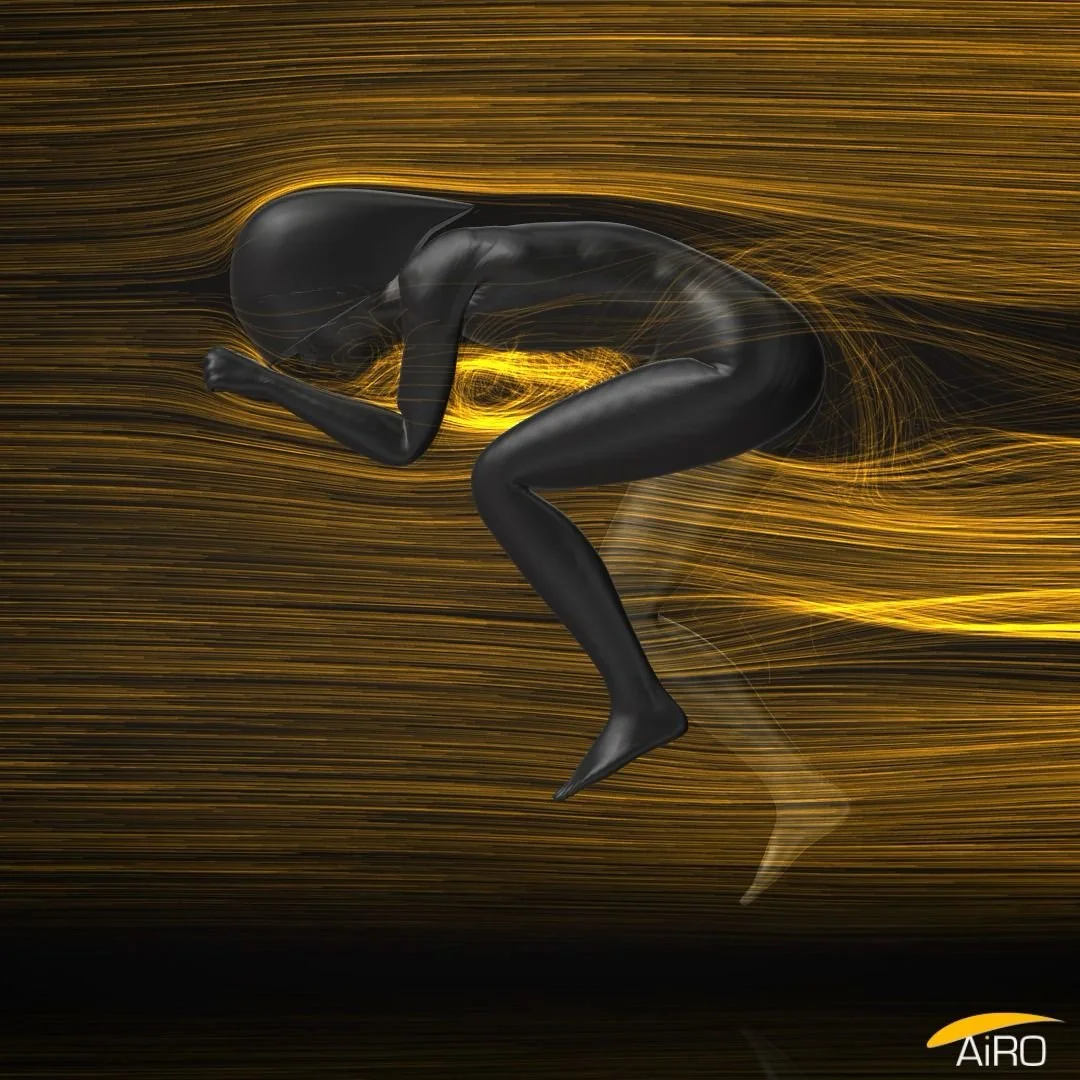
After policing sock height, the UCI is now closely looking at women's chests.
Last week at the Tour de France Femmes, riders queued outside a tent near the start ramp so that a commissaire could look at their sports bras before they were allowed to race. The rule being enforced, UCI Article 1.3.032, forbids items that modify a rider's morphology. Applied to a water bottle stuffed down a jersey, that is a clean rule. Applied to a bra, it requires an official to form a judgement about how much of a woman's chest is hers.
The sport arrived here for a reason, and the reason is a paper. In 2024, Blocken, Malizia and van Druenen published the first peer-reviewed study of chest fairings in the Journal of Wind Engineering and Industrial Aerodynamics. It found that the largest fairing tested reduced drag by 3.6%, worth around 19.5 seconds over a 25 km time trial, and concluded that a chest fairing "can decide who wins or loses." That number went everywhere. I would be surprised if it has not been read by every performance department in the WorldTour, and I would be equally surprised if the current wave of padded bras is unrelated to it.
So the questions the peloton is now asking are real ones, and they get uncomfortable fast. If padding is banned because it changes body shape, what about a compression bra that flattens? What about a rider who has had breast augmentation, or reduction? Is that equipment, an illegal body modification that bans you for life, or a personal life decision? Does a commissaire get to have an opinion about it? Nobody wants to write that rule, and nobody wants to be checked against it.
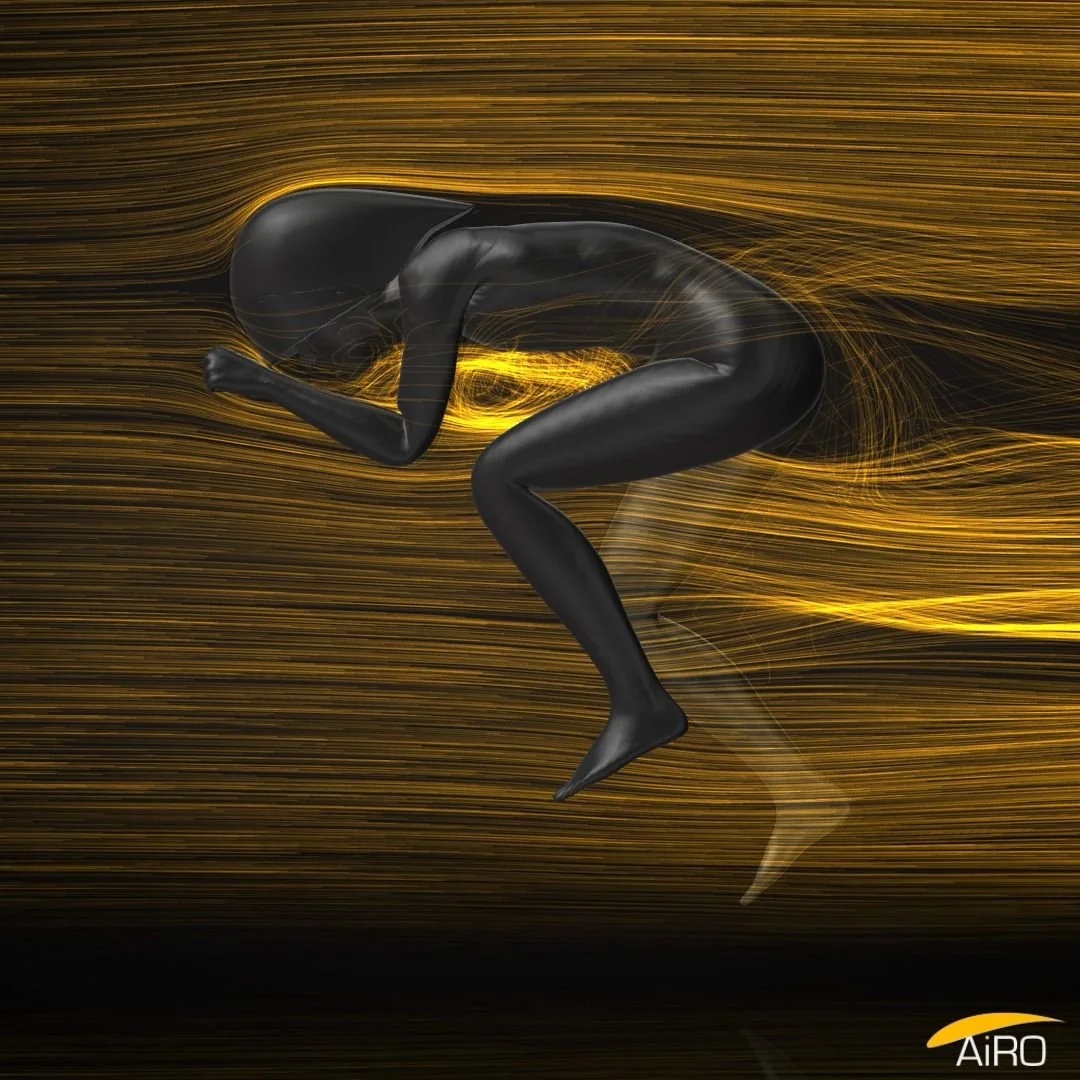
AiRO’s Digital Aero Twin Technology can not answer the societal implications, but we can quantify the effect to help steer the discussion with data. So we measured the effect of 3 different chest sizes on the aerodynamics of women, with two different helmets, and compared it to a male chest fairing (modelled after a water bottle tucked into the jersey) .
What happened
On Sunday, WielerFlits reported that several Women's WorldTeams had asked the UCI to enforce Article 1.3.032 against riders allegedly padding sports bras in time trials, noting that some riders appeared to have a larger chest in time trials than in road races, including at the Paris 2024 Olympics.
By Monday evening the race jury had added an unusual warning to the Tour de France Femmes communiqué, promising "particular attention" to clothing and accessories that could modify riders' morphology.
The riders learned the details roughly when the press did. CPA president Marina Cappellotto sent a note hours before the start asking why. Grace Brown, speaking for The Cyclists Alliance, made the point that has no good answer: how do you check this without invading privacy, when some women simply have fuller chests? Koen de Kort at Lidl-Trek put the same problem from the engineering side to The Athletic — you can say padding is not allowed, but how do you say how much a woman needs?
Nobody was disqualified. The commissaires found ice packs.
What we measured
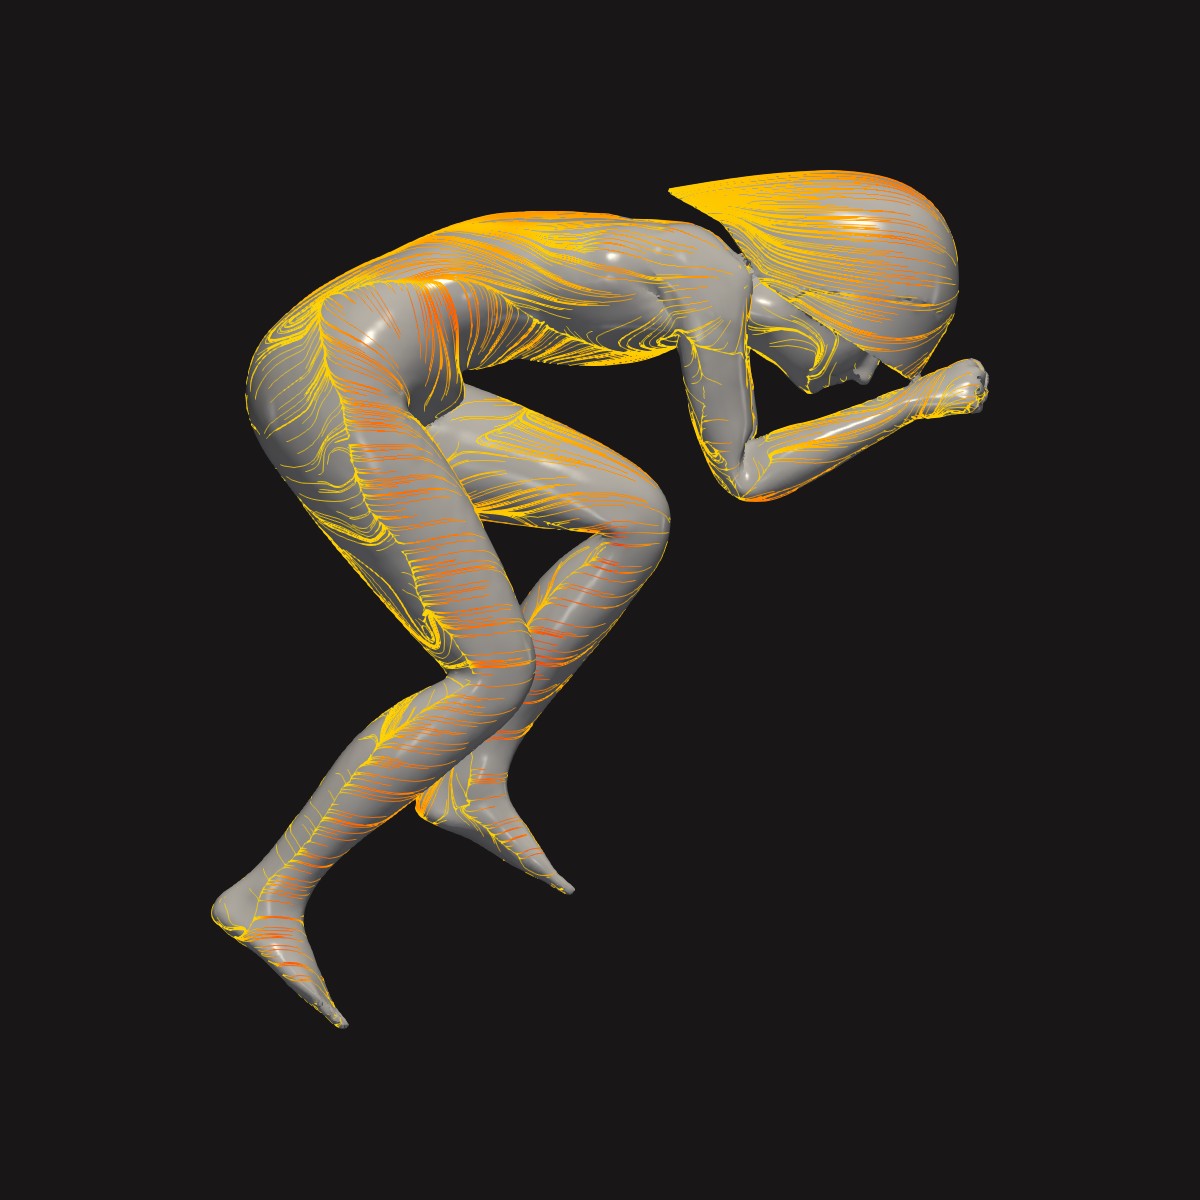
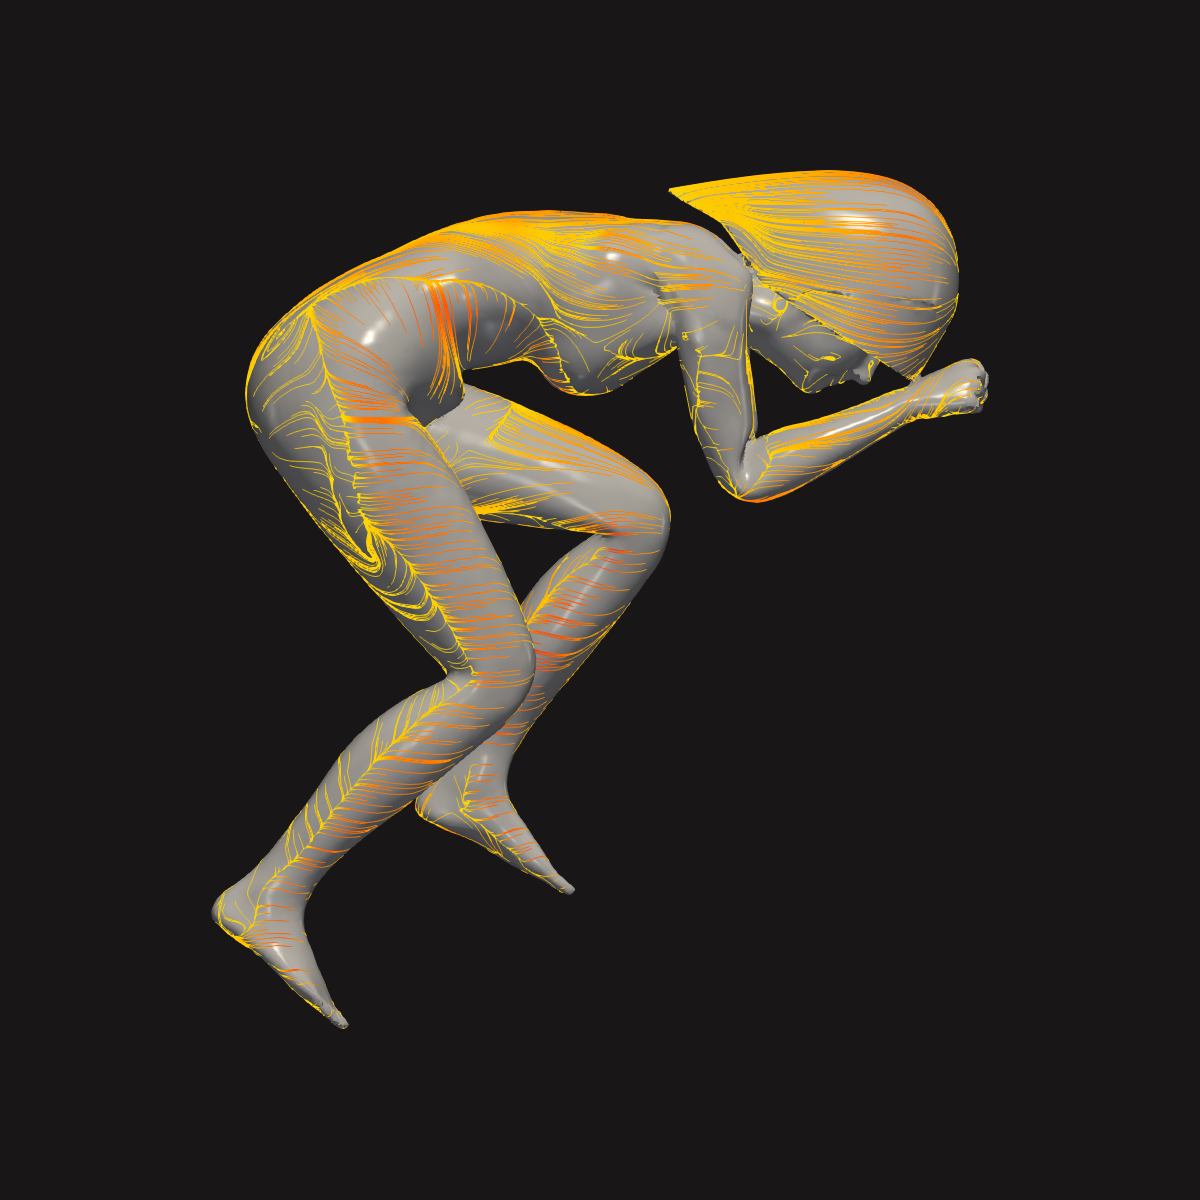
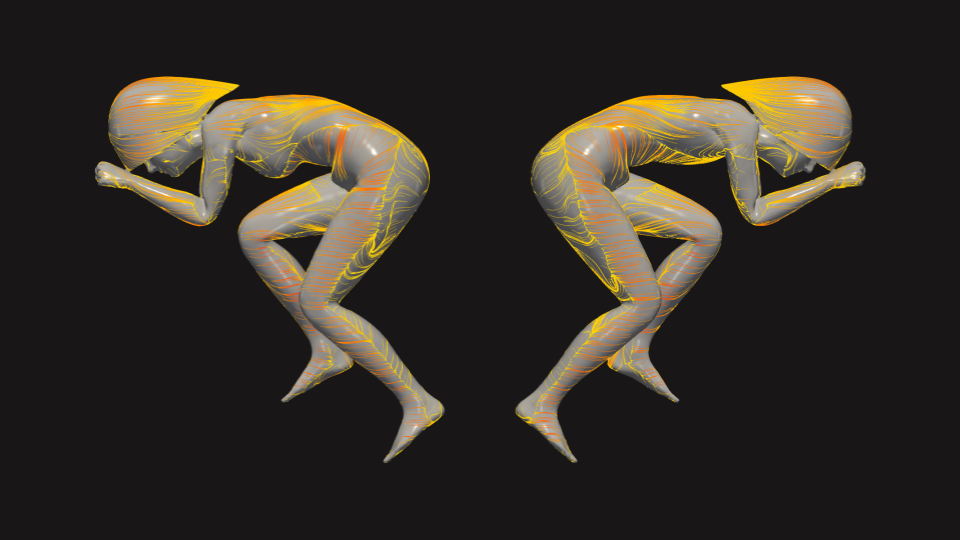
We ran the question directly. One digital aero twin per sex, held fixed — same skeleton, same position, same general body shape with only the chest volume changed. For the women, three padding levels: small, medium, large. For the man a bottle-shaped fairing under the skinsuit. Each case was run on two different helmets, because a chest fairing changes the flow arriving at everything downstream of it and there was no reason to assume the helmet was neutral.
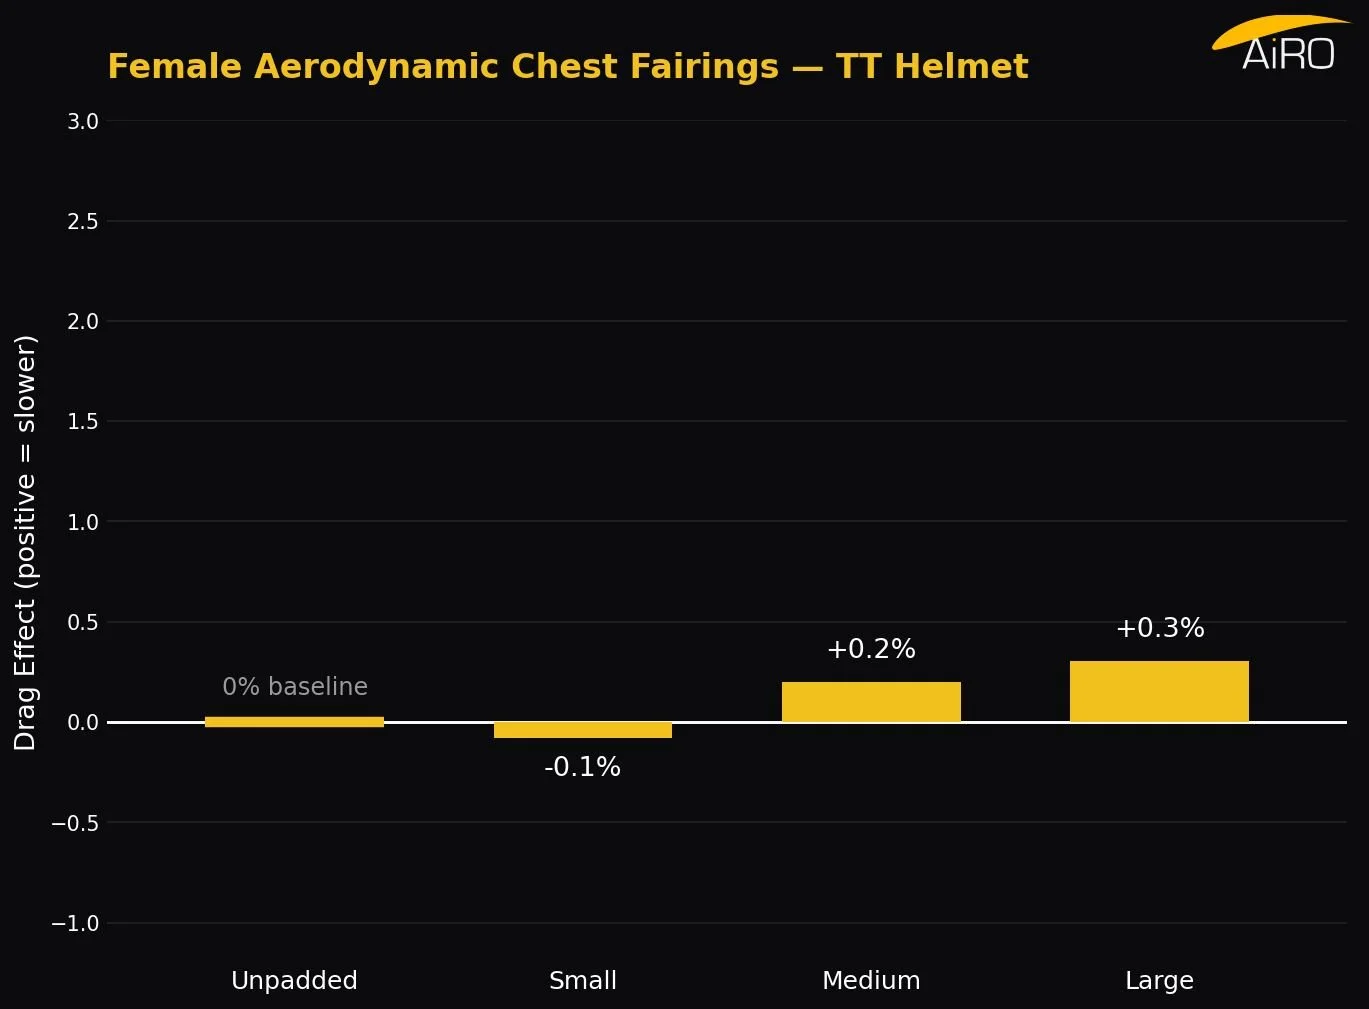
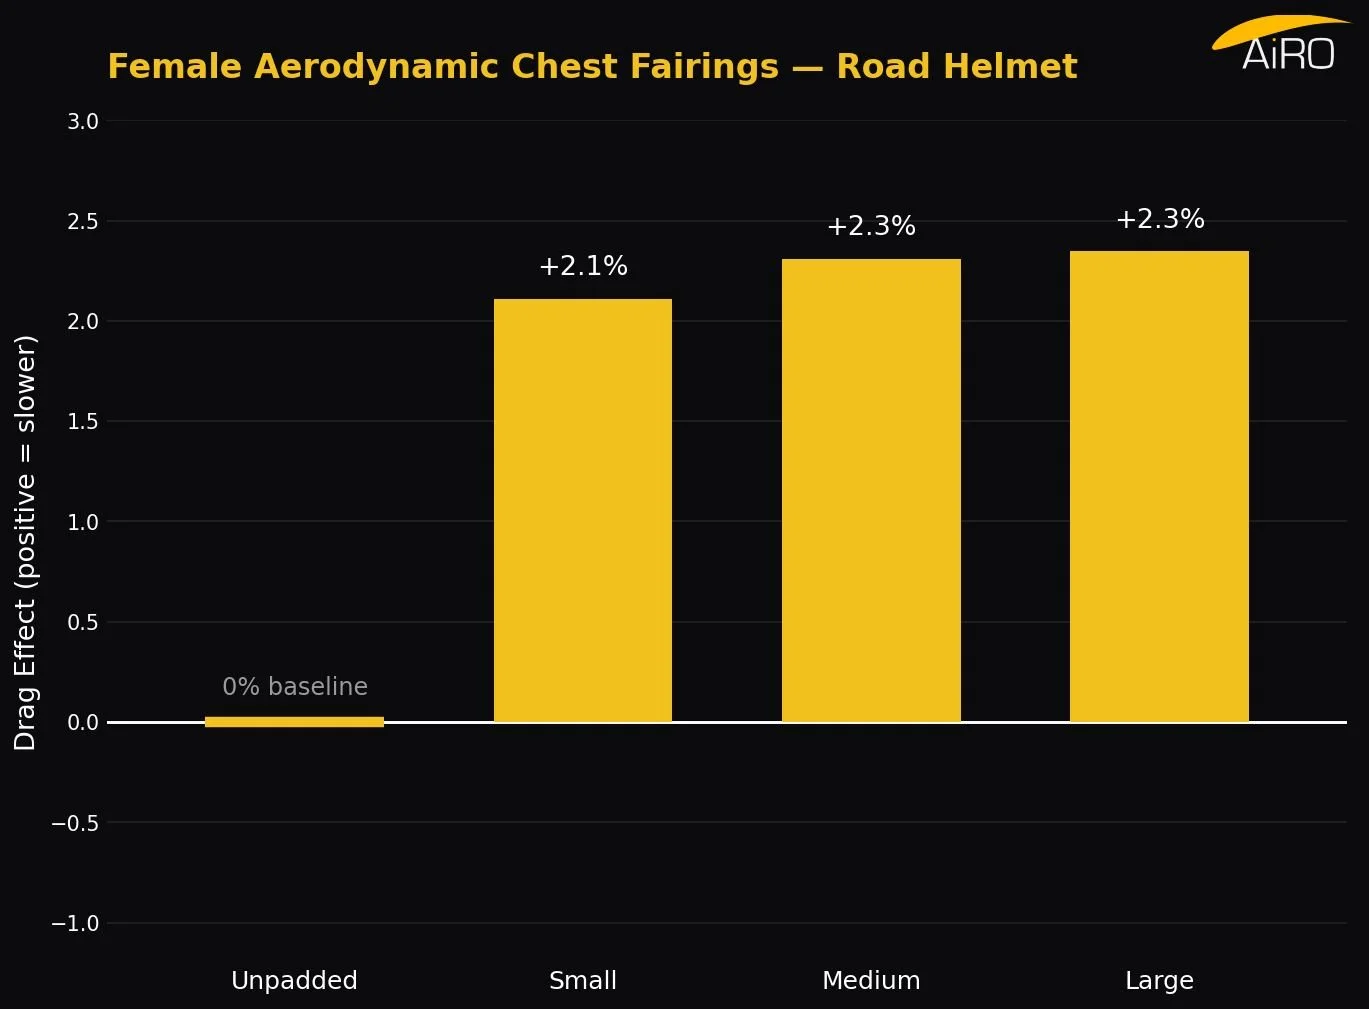
Here is the female result on the Specialized Evade and the Ekoi Pureaero.
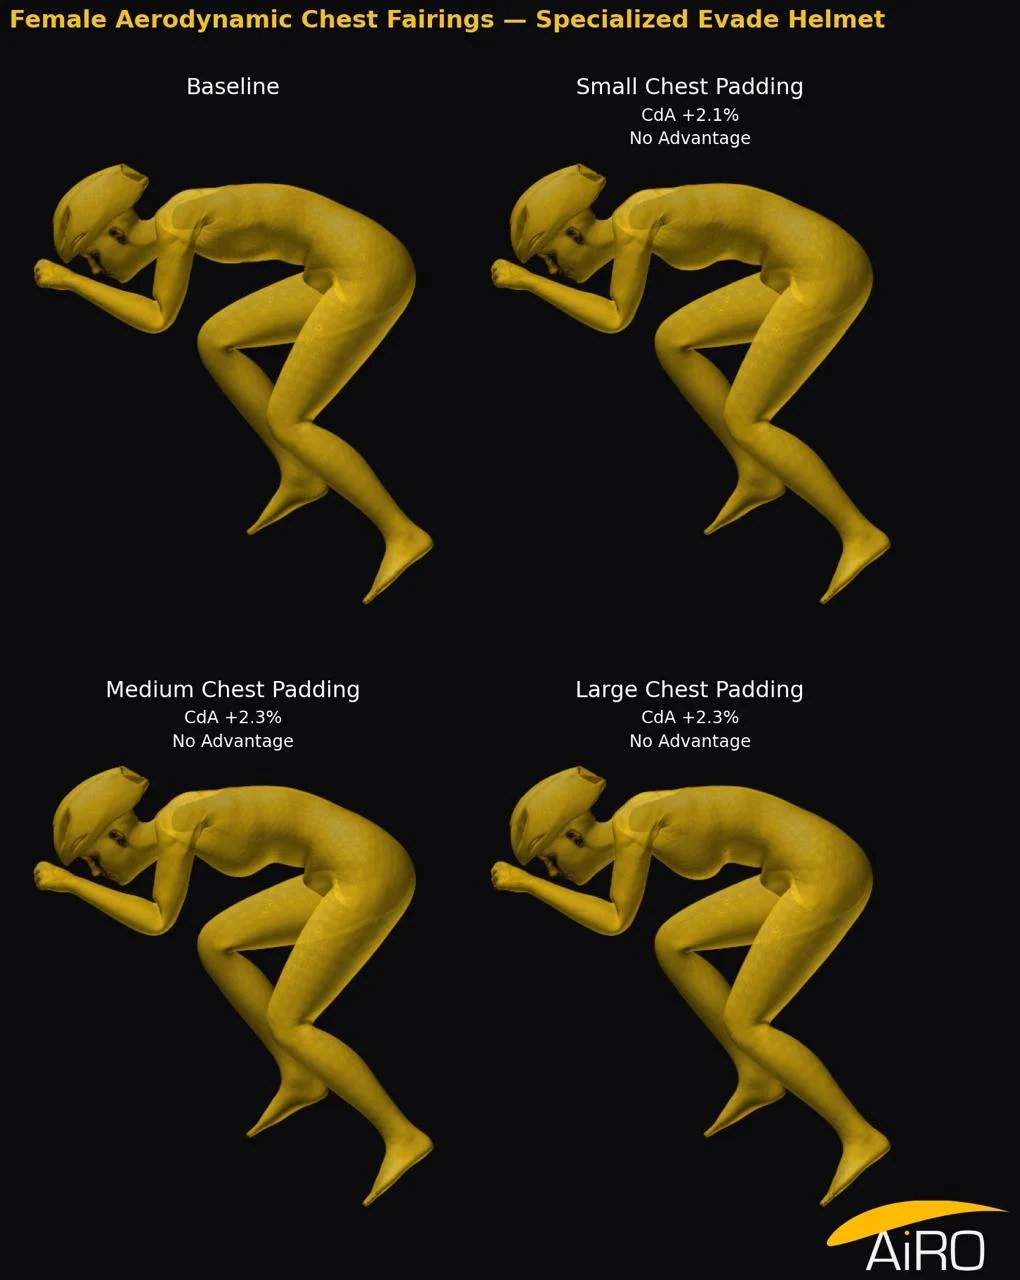
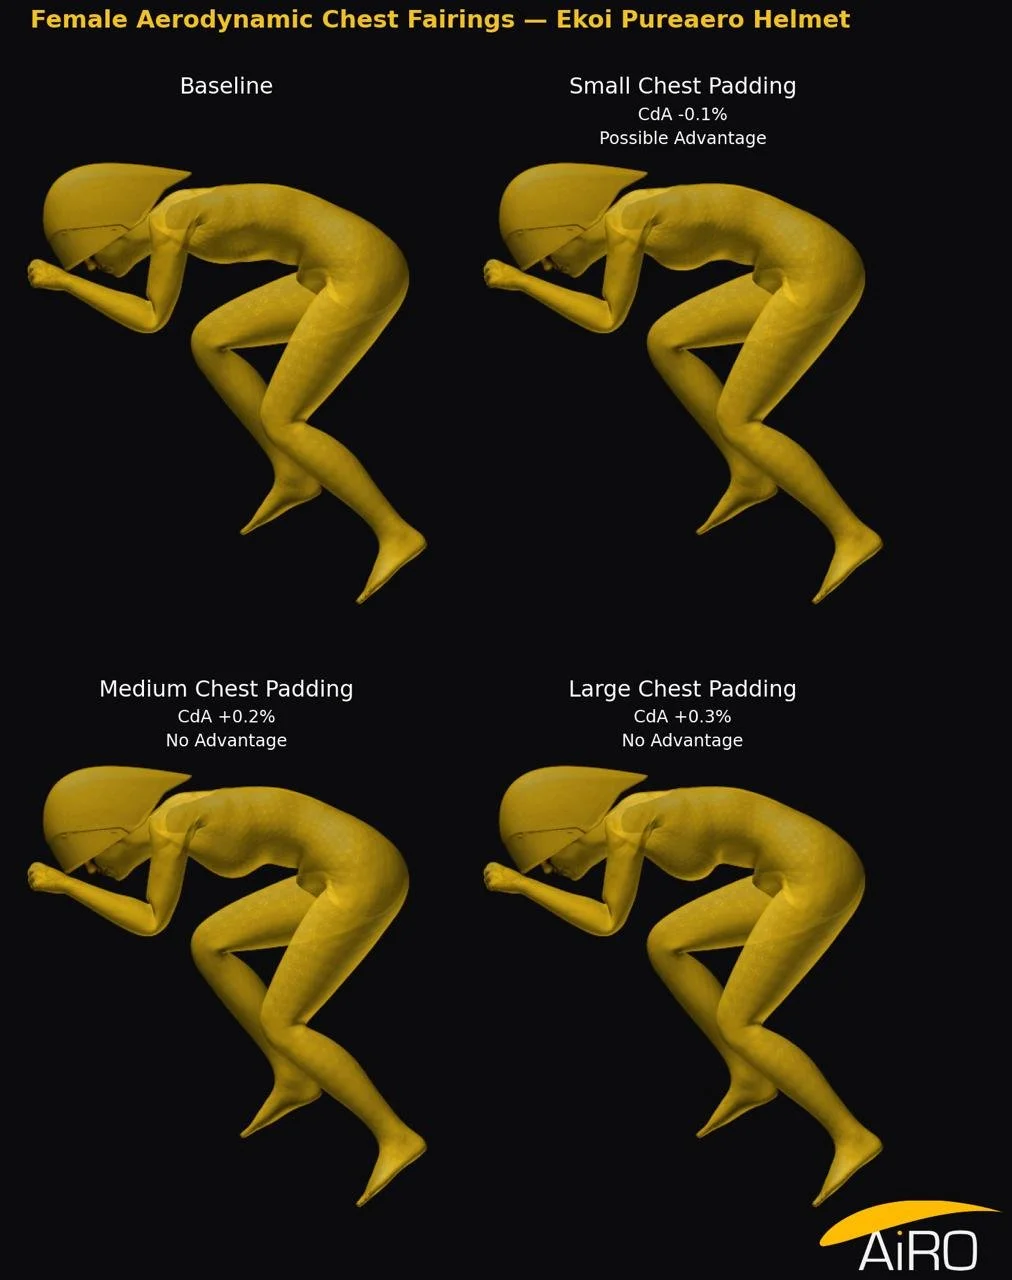
Positive means slower. On the Evade, all three padding levels came out around +2.2%, meaning larger chest sizes tested slower. On the Ekoi, the same three morphologies landed at −0.1%, +0.2% and +0.3%, which is nothing at all. Not one configuration produced a measurable gain, and going from small to large padding barely moved the number on either helmet.
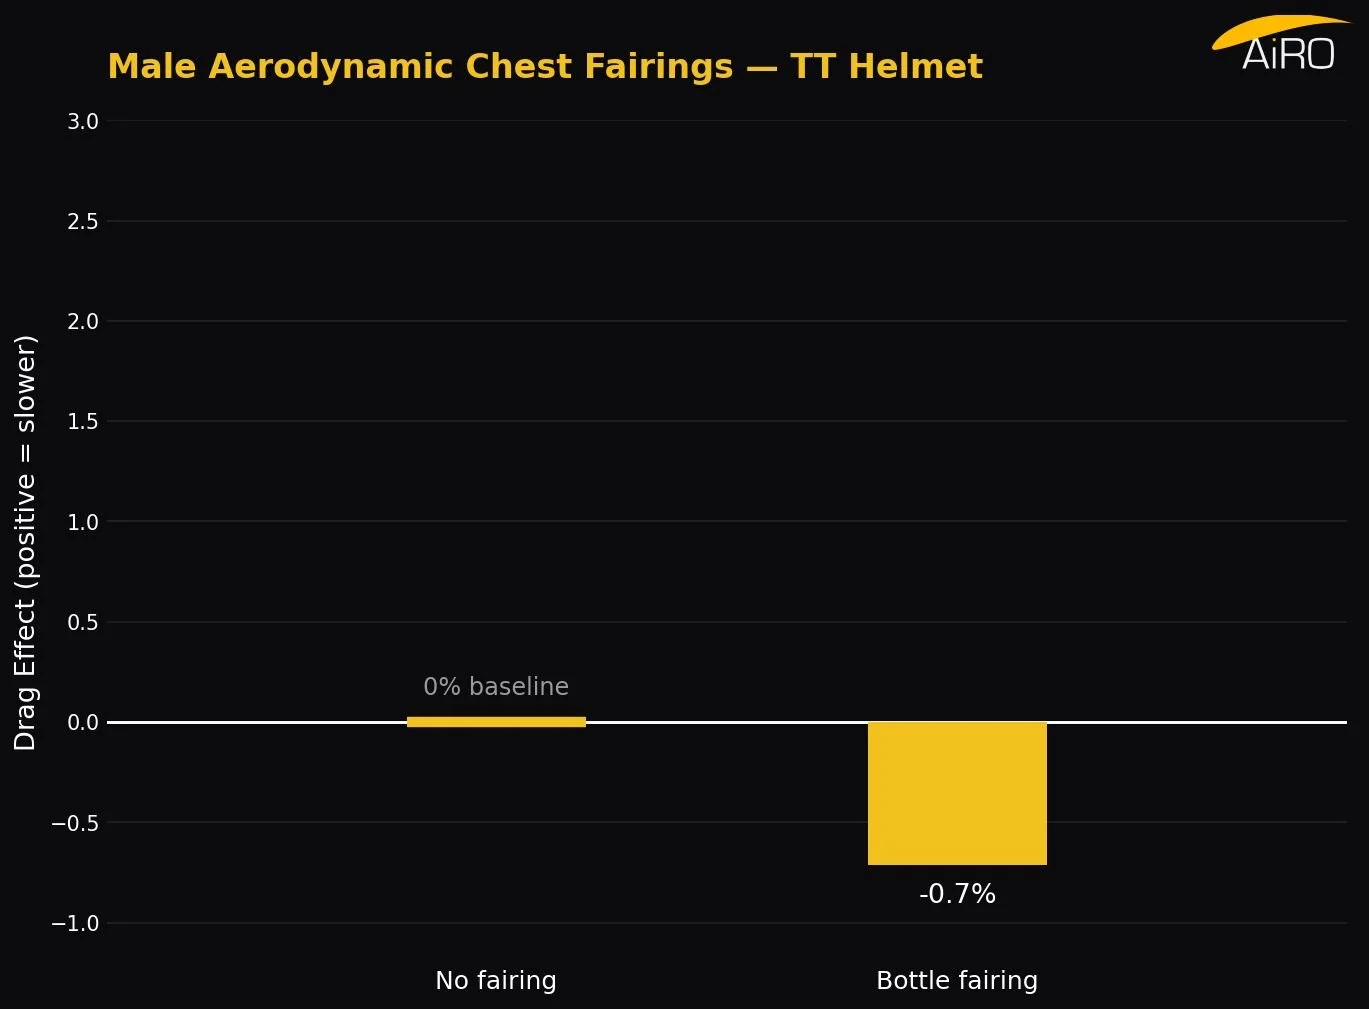
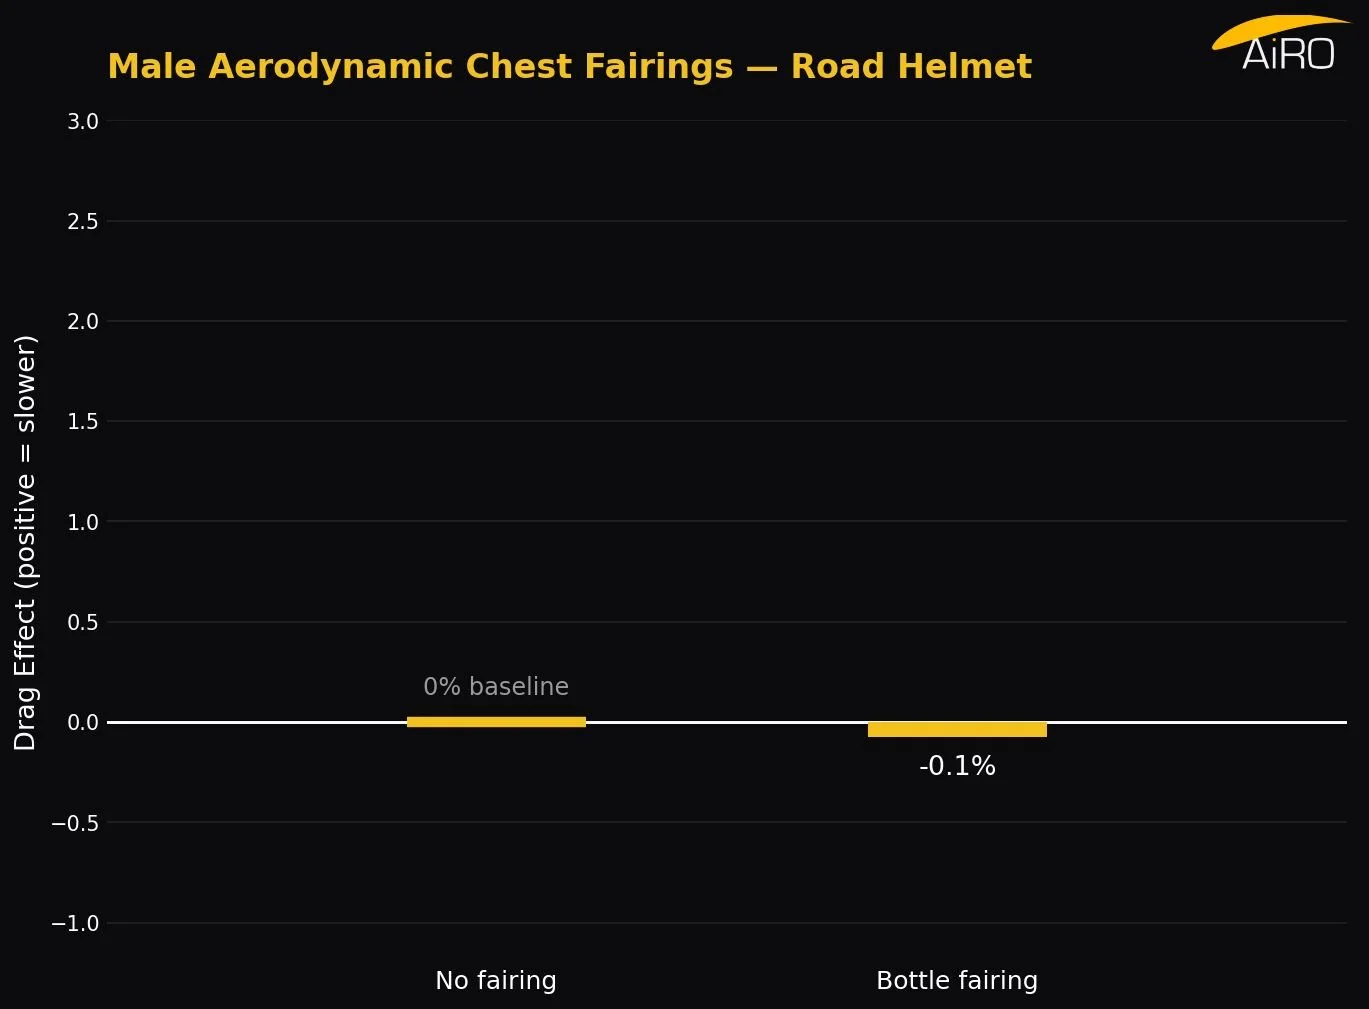
Let us compare those results with a proper fairing, like a water bottle stuffed down a jersey as has been seen by some male riders in the past.
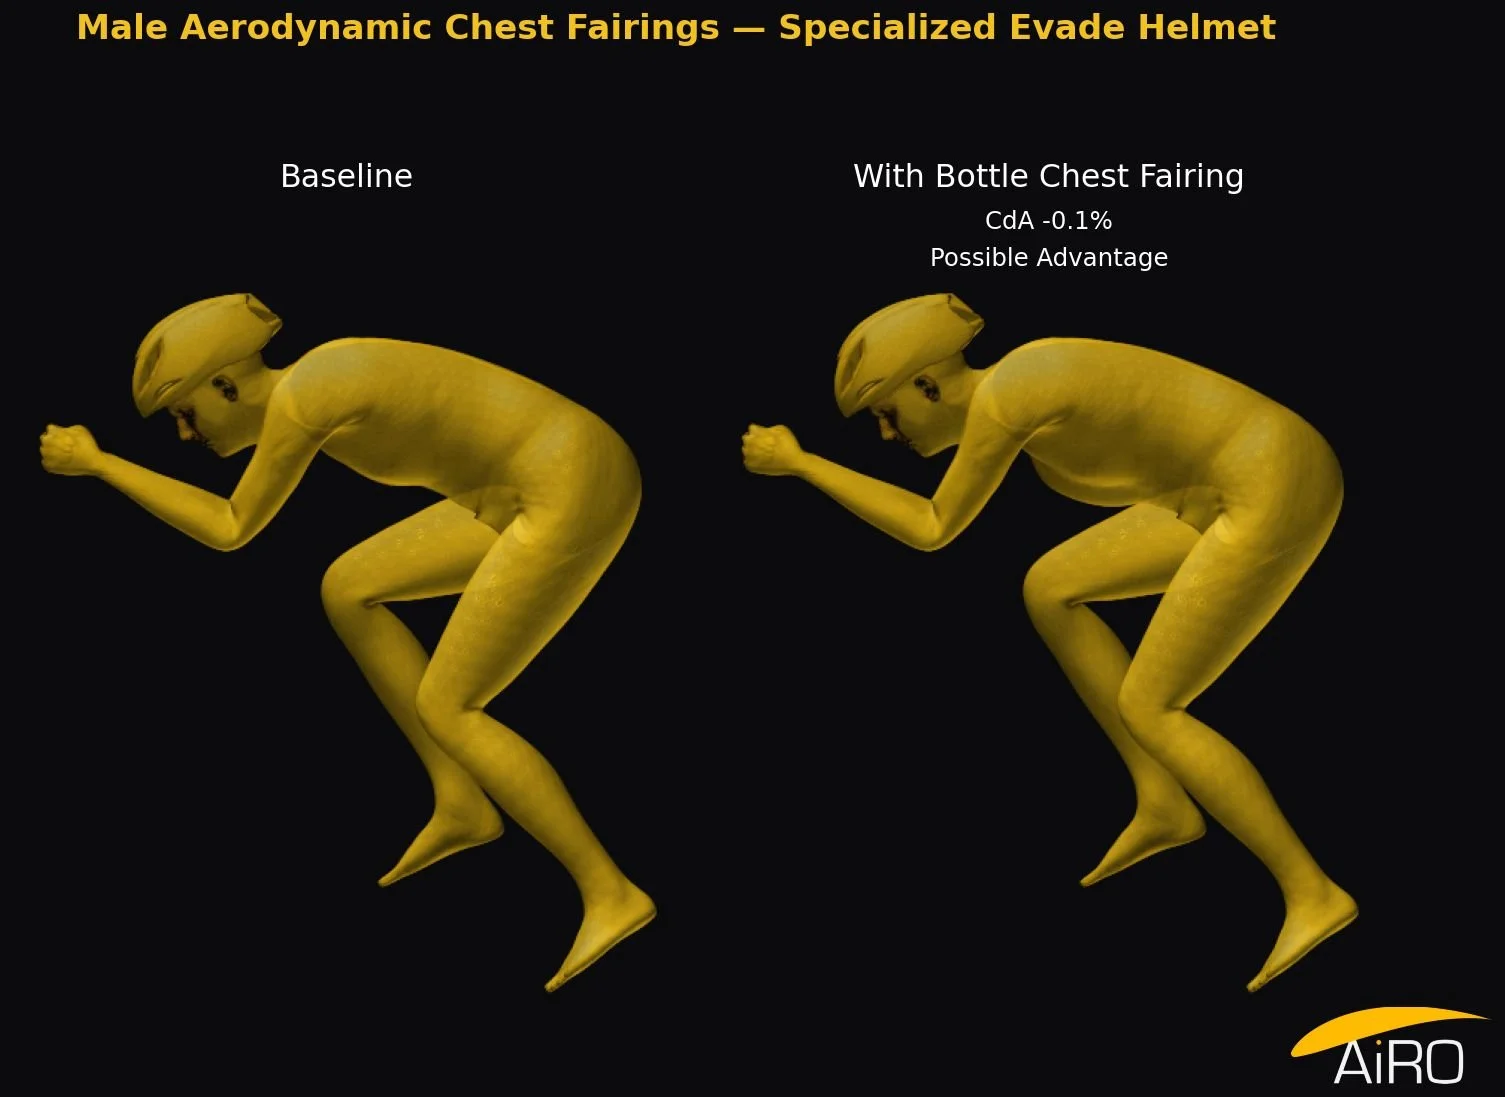
−0.7% on the Giro Aerohead, −0.1% on the Specialized Evade. The best case is a possible small advantage that is within measurement uncertainty. That is with an object under the suit, on a male rider, in a full time trial position. Changing chest volume by the amount a padded sports bra can change it did nothing on either helmet, for either sign, at any of three sizes.
This study has limitations: One rider per sex, and all cycling aerodynamics is sensitive to the individual: Different torso, different position, different result, but the results show that bra stuffing is at least not clearly a benefit.
How this compares to the published literature
Blocken's team tested seven fairings. Three of them were small, in the size class of what you could plausibly hide in a sports bra. Those three returned drag changes of +0.54%, +0.39% and −0.68%. Two nearly invisible improvements and one that made the rider slightly slower.
The 3.6% headline came from “Chest Fairing 4”: a solid prismatic block 313 mm wide and 87 mm tall, spanning the rider's entire chest, modelled on what triathletes were using in Kona. The other two configurations that produced real gains, at 2.57% and 2.03%, were the same species of object.
Conclusion
Our data and the published literature agree on the point that matters for this controversy: Small chest volume changes, as they could be hidden in a sports bra do not seem to make riders faster. Athletes need a large object, at least the size of a large bottle, correctly shaped, to get into the range where anyone should start to care. That object is visible, it is already illegal, and needs no additional policing of sensitive body parts.
Blocken, B., Malizia, F., van Druenen, T., "CFD analysis of chest fairings in time trial cycling," J. Wind Eng. Ind. Aerodyn. 248 (2024) 105709. Open access under CC BY 4.0.
All presented simulations were created using AiRO’s Digital Aero Twin Technology. AiRO.app, contact: Ingmar Jungnickel (Ingmar@airo.app)
AiRO in the News!
AiRO in the Frankfurter Allgemeine Zeitung: What Pro Aero Tells Us About Fitting Every Rider
During this year's Tour de France time trial, one of Germany's most respected newspapers — the Frankfurter Allgemeine Zeitung, with a readership of over a million — reached out to our founder Ingmar Jungnickel to explain the science behind how pro cyclists beat the wind.
We're proud of the feature, and it got us thinking: the same principles Ingmar described at the WorldTour level apply directly to the athletes bike fitters work with every day.
Wie schützen sich Tour-de-France-Fahrer vor dem Wind?
The gap between pro and amateur isn't the physics — it's the access
What makes aerodynamics fascinating is that the underlying science doesn't change based on who's riding. The drag penalty for a poorly optimized position is the same whether the athlete is racing the Tour or training for a local gran fondo. What has historically changed is who could afford to measure it.
Wind tunnels, dedicated team aerodynamicists, €18,000 custom skinsuit prototypes — these exist in the WorldTour because teams have the budgets to support them. But the watts saved by finding the right position aren't exclusive to riders with those resources. The opportunity has always been there. The tools just weren't.
That's the gap AiRO was built to close. CFD-based aerodynamic analysis, delivered in minutes from a bike fit session, brings the same methodology that shapes Tour de France performance to fitters working with amateur athletes, age groupers, and everyday cyclists.
Why position is always the starting point
Ingmar has spent his career making this case, and the physics keep proving him right: the rider is a far larger aerodynamic variable than the equipment. No amount of frame optimization changes that. A fitter who understands aerodynamics and has the tools to quantify it is offering something a bike shop or equipment upgrade simply can't replicate.
That's the conversation the FAZ piece opens up — and it's the conversation we think every serious bike fitter should be having with their athletes.
Curious what CFD analysis looks like inside a fit session? [Book a demo → airo.app/calendar]
When the Wind Tunnel Agrees With the App
A Real-World AiRO Story from New Zealand
Every so often, a customer story lands that does more for credibility than any spec sheet or feature list ever could. This is one of those stories.
In a recent episode on Fitter Radio Triathlon Podcast, host Jack sat down to recap a session he and his co-host had with Justin Ralph of Velo Performance in Hamilton, New Zealand — one of the fitters who uses AiRO to guide aerodynamic and positional decisions for his athletes. The full conversation is worth a listen: watch it here.
A rainy Friday, a laptop, and ten minutes of pedaling
The session itself was refreshingly low-friction. Jack changed into kit, had a few reference photos taken to capture his real riding position (not an idealized "aero tuck" he'd never actually hold on the road), and spent about ten minutes just pedaling comfortably on the trainer. From there, everything moved to the laptop.
That's the part worth pausing on. No wind tunnel booking, no six-figure lab, no all-day session — just a rider, a fitter, a bike, and a platform that turned a handful of photos and a calibrated setup into a working aero model. Justin and Jack were then able to manipulate the model directly: shifting position up, down, forward, and back, and watching the impact in real time.
The helmet library: small market, big unlock
The moment that really lit things up, according to the episode, was AiRO's helmet library. For fitters working in smaller markets like New Zealand, getting hands-on access to the newest helmets is genuinely hard — and expensive. Premium helmets can run over a thousand dollars each, which makes it impractical for most fitters or riders to stock a shelf of options just to test them.
AiRO's growing library sidesteps that problem entirely. And because the underlying models improve with more scanning data, the library isn't static — it's expanding month over month, giving fitters access to gear they'd otherwise never get to evaluate for a client.
The part that matters most: it matched the velodrome
Here's the detail that should matter most to anyone evaluating AiRO's accuracy claims. Jack had prior real-world aero data on two helmets from actual velodrome testing sessions. When he and Justin ran those same helmets through AiRO, the app produced a wattage difference between the two helmets that closely mirrored what had already been measured on the track.
Justin, by his own admission on the episode, was initially skeptical of the result — until they pulled up the old velodrome reports and confirmed the numbers lined up. That skepticism-to-validation arc is exactly the kind of moment that builds trust with fitters who are used to relying on physical testing as the gold standard.
The story went further: a helmet that had tested surprisingly well for Jack in the velodrome, but had underperformed for most other riders Justin had since tested in real life, showed that same rider-specific pattern when run through AiRO. In other words, the app didn't just get the average right — it appeared to pick up on something specific to Jack's position and physiology that matched what real-world testing had already shown.
Why it's worth paying attention to
What makes this story stick is that nobody involved was trying to prove anything — Justin was testing the platform out of curiosity, brought his own skepticism into it, and only came around once he pulled up his own historical data and saw it lined up. That's a harder kind of validation to manufacture than a curated case study.
If you're a fitter deciding whether a photo-based aero model can actually hold up against physical testing, this is a fair example to weigh. And if you're a rider curious what a session like this even looks like, the short version is: no wind tunnel booking required, no all-day session — just your bike, your position, and about ten minutes on the trainer.
Full episode: The AiRO App – Jack's Experiences
The Aero Questions Nobody Asks
Ingmar gets asked a lot of the same questions in interviews: the athletes he's worked with, how AiRO started, the Olympic medals. Barry from Regroup Fit skipped all of that. Instead, he asked the questions fitters actually argue about on the shop floor. Saddles versus tires. Boas versus laces. Smooth legs versus stubble. Here's what came out of it.
Posture beats the bike, every time
The single biggest lever for any athlete, amateur or pro, is fit and posture. Ingmar puts it plainly: 60 to 80% of an athlete's drag comes from their position, not their equipment. A rider can spend $15,000 on a frame and get a fraction of the gain they'd get from a few hundred dollars spent dialing in posture. Over an Ironman distance, that's worth roughly half an hour. Half an hour is the difference between qualifying for Kona and not.
The best ROI in the shop isn't aero gear
Before any aerodynamics conversation, comfort comes first. If an athlete hates their saddle, they won't ride enough to hold a good position anyway, so a real saddle fitting process matters more than people think. After that, Ingmar's pick for best bang for buck is tires. The gap between a mid-range tire and a high-end one is bigger than the gap between a mid-range frame and a high-end one, and it only costs an extra $20 to $50. His advice: if you can afford the bike, you can afford the good tires.
And on the wide-vs-narrow debate, wide wins. Wider tires and wheels hold up better in real-world conditions: rough roads, comfort, handling. Unless someone's racing a pursuit on a velodrome, the wider setup is the faster one once you account for actual riding conditions.
Small details, real watts
A few quick-fire answers worth knowing:
Boas are the comfort pick and laces are marginally faster, so Ingmar's advice for racers is to run both: laces for race day, Boas for training.
Shoe covers matter less than people assume. Most of the aerodynamic gain doesn't come from covering the shoe, it comes from the texture on the lower leg, which is why aero socks work the way they do.
Leg hair actually matters. Cyclists sit right in what's called the transitional speed range, where surface texture has an outsized effect on drag. It's the same principle behind textured skin suits, which Ingmar calls one of the bigger performance opportunities available right now, if you can find the right one for your body.
Fitting female athletes: proportion over gender
Ingmar's take here cuts against a lot of assumptions. Differences in proportion within a gender are actually larger than the average differences between genders, so the real variable to watch is how shoulder width compares to hip width, not the athlete's sex. Wider hips generally tolerate a wider handlebar stance better; narrower athletes benefit more from going narrow.
He also flagged a counterintuitive finding on breast aerodynamics: the presence of breasts tends to help drag, not hurt it. The more common issue is the sports bra itself, where a thick back panel can create a ridge that disrupts airflow.
Where bike design is actually headed
Ingmar's prediction: cockpits are going higher, not lower. Pro TT bikes have already added 10 to 15cm of stack over the last decade because shrugging the shoulders and bending the arms is a major drag reduction, given the arms alone account for roughly 25% of total drag. His view is that most current stack numbers are 5 to 10cm too low, and that the trend will keep moving in that direction.
There's an unexpected overlap with gravel bikes here too. Bigger wheel diameters (think 32-inch) already improve rolling resistance, and they happen to add the same few centimeters of height that the aerodynamics suggest cockpits need. Two unrelated trends, same destination.
A challenge to the UCI
Asked which UCI rule he'd scrap, Ingmar didn't pick a specific regulation. Instead, he questioned the philosophy behind the Lugano Charter, the UCI's founding stance that technology shouldn't be allowed to dominate the sport. His argument: cycling has always been about pairing human performance with mechanical innovation, that's the entire premise of the bicycle, and a governing body explicitly resisting that puts it at odds with both fans and equipment makers. He's not arguing for unlimited tech. He's arguing the conversation is worth having.
Watch the full conversation with Barry from Regroup Fit below.
LOWER MAKES YOU SLOWER
INTRODUCTION
For many years, the general belief was that going with a lower cockpit position or handlebar was making cyclists faster. Then, that philosophy changed first on Time Trial bikes. Engineers and sports scientists discovered that forcing a rider into an ultra-low, stretched-out position eventually hit a wall of diminishing aerodynamic and metabolic returns. Instead, the paradigm shifted toward higher elbows, an increased forearm angle, and hiding the rider's head and helmet directly behind their hands.
This structural shift gave time trialists the ability to become significantly more compact in the front. With higher elbows, higher hands, a narrower elbow stance, and the head cleanly positioned behind the arms and hands, riders unlocked an entirely new anatomical advantage: the ability to achieve higher scapular retraction and an aggressive shoulder shrug. All of this made time trialists undeniably faster.
Could the same be achieved on a road bike?
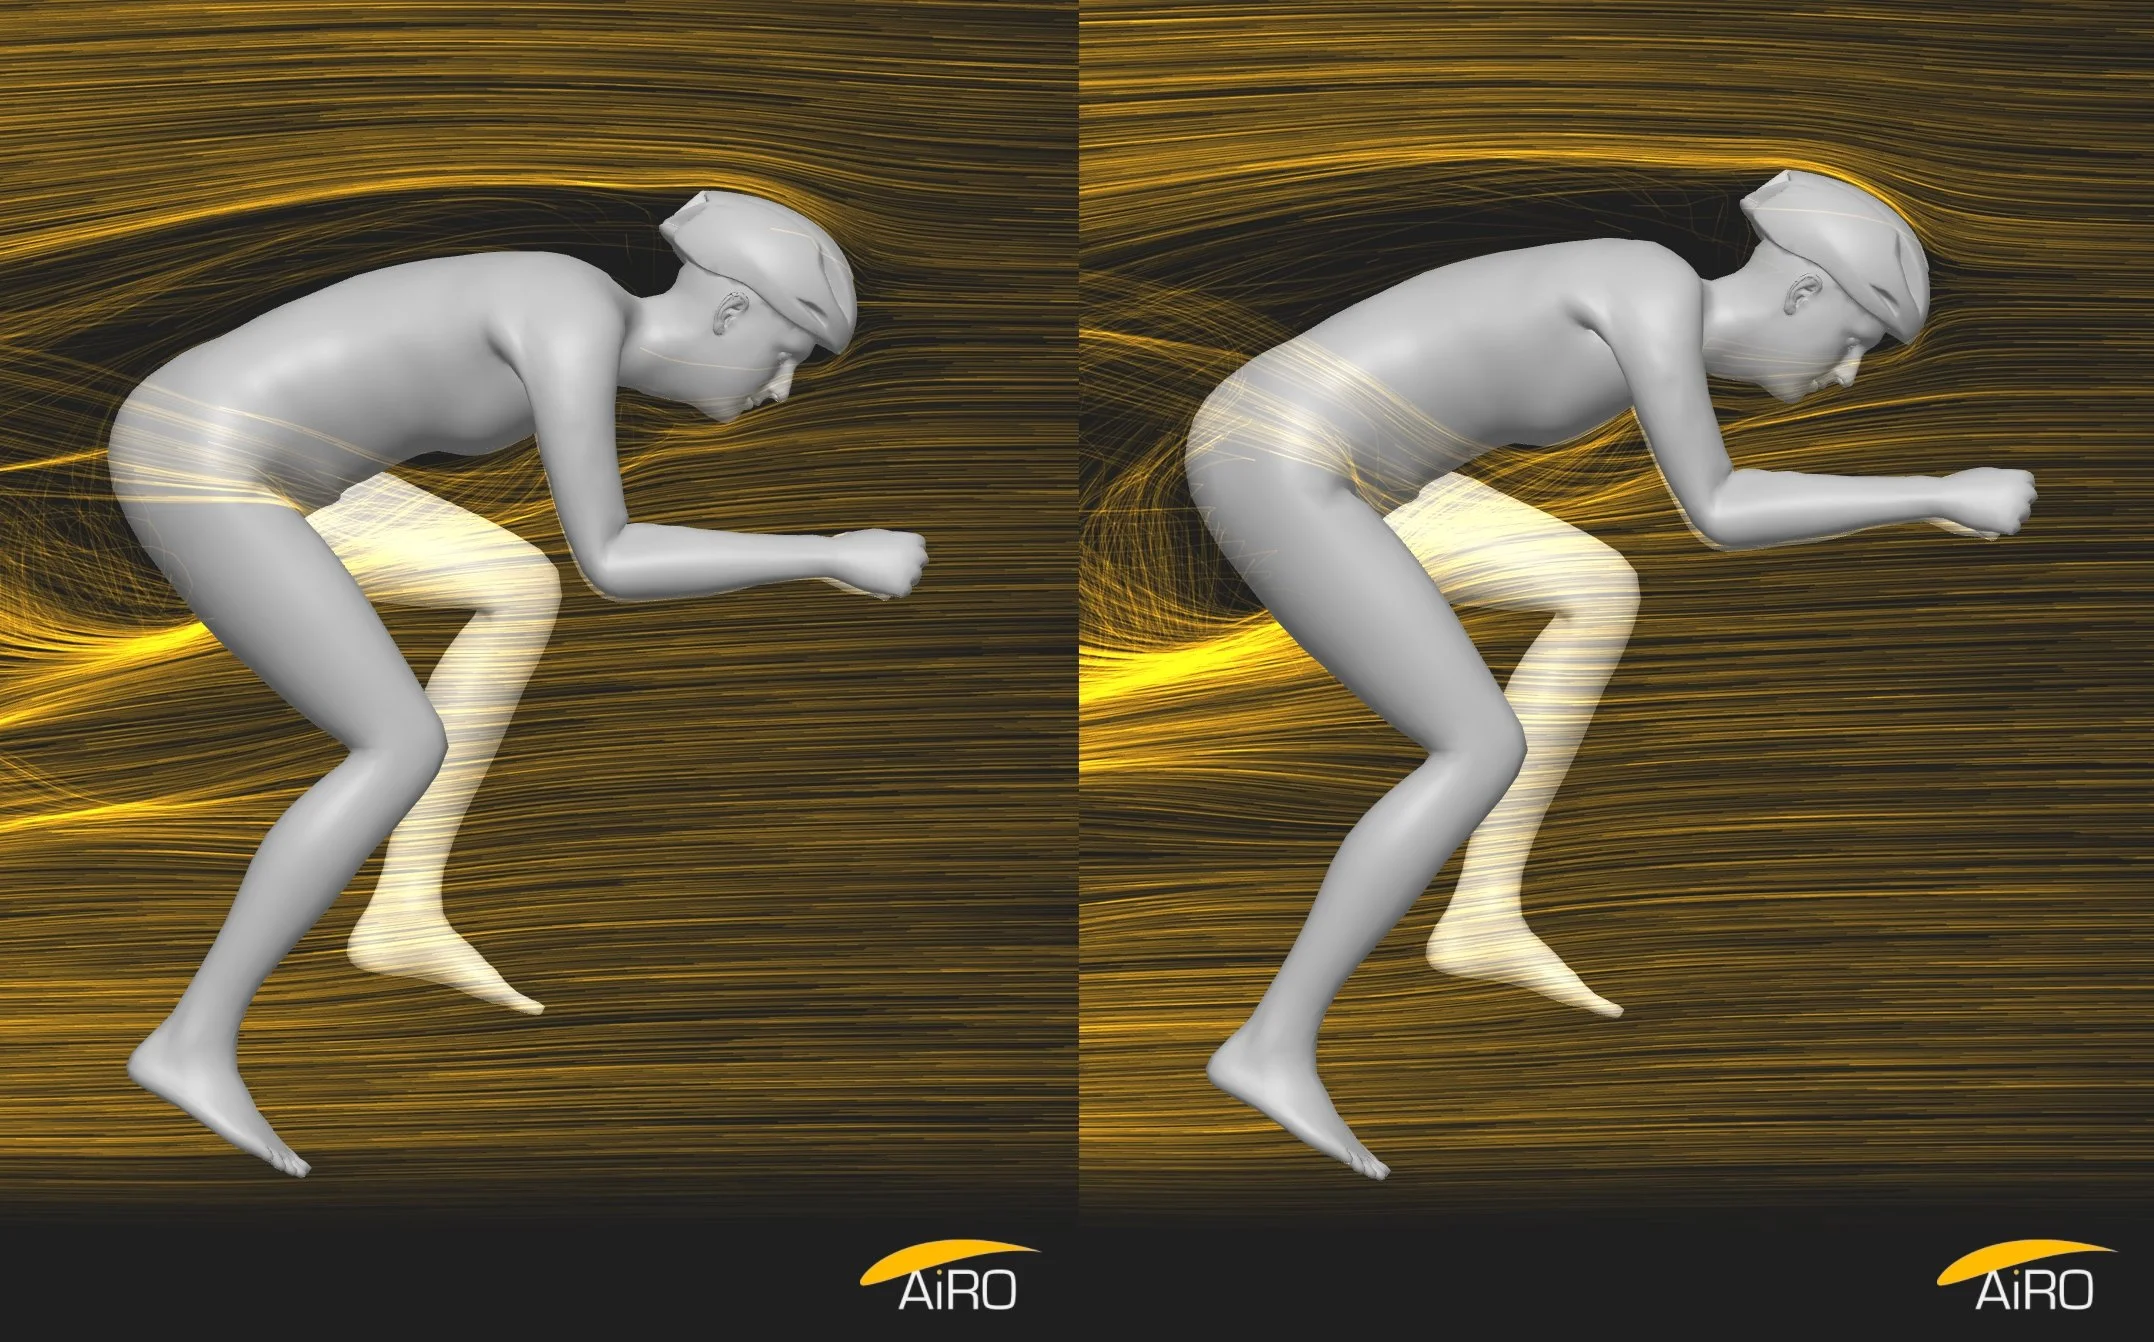
From low & short (left) to high & long (right)
The professional peloton didn't just ask this question; pioneering riders began actively manipulating their hardware to exploit it. The most striking real-world manifestation of this theory was Dutch professional Jan-Willem Van Schip's radical forward-facing position. Utilizing highly unconventional stem lenght and angle & handlebar width and orientation, his setup replicated a track or time trial position on a standard road bike, physically supporting his forearms and elevating his hands to force an extreme thoracic and shoulder tuck.
The position was so aerodynamically dominant, but also questionnable in term of riders safety, that it was ultimately banned by the UCI under strict equipment compliance rules. However, the engineering proof was undeniable: raising the front end to allow the human body to collapse into a smaller, tightly integrated silhouette made him systematically faster than stretching out over a super low, slammed stem.
THE MORPHEUS BIKES AND LATEST AERO ENDURANCE BIKES PHILOSOPHY
To decode why a lower front end can make a cyclist slower, we look to the design framework of innovators like Morpheus Bikes. Their core philosophy argues that a bicycle frame cannot be optimized in a vacuum; its geometric performance is entirely dependent on the active biomechanical and aerodynamic limits of the human engine.
When a rider is forced into a traditional, aggressively low road geometry, two fluid dynamic and physiological penalties occur simultaneously:
The Biomechanical stress: The hip angle closes down excessively at the apex of the pedal stroke. This directly degrades sustainable wattage output. Shorter crank arms help opening the hip angle but they also require increasing saddle height which also increases saddle to handlebar drop thus requiring increasing the handlebar stack even more.
The Aerodynamic Paradox: As the chest is pulled down too close to the top tube, the shoulders naturally widen out to support the skeletal weight of the torso. To see the road ahead, the rider must crane their neck upward, lifting both head and helmet into the clean air stream, generating massive flow separation and turbulent wake behind the back.
By re-engineering front-end geometry to support higher hand placement, the Morpheus philosophy decompresses the rider's upper body. This preserves an open hip angle for unconstrained muscular recruitment while giving the rider the literal physical space needed to drop their head into the clean air pocket carved out by their hands.
Endurance bikes launching in 2026 tend to share some of those principles: aero shapes, lower bottom bracket, higher handlebar stack. Although trending in the right direction, they often lack a few millimeters of reach and achieve proper front to center distance (to prevent toe overlap) by offering a slacker head tube angle and forks with slightly more rake. It makes for more stable bikes to the detriment of faster, racier handling that racers may prefer.
The Hardware Evolution: Rise Cockpits
Historically, raising a cockpit meant stacking multiple round headset spacers underneath a conventional stem—a solution that is both structurally inefficient and aerodynamically dirty. To facilitate this high-hands positioning without compromising frontal area aesthetics or internal cable management, advanced component designs have emerged.
Many examples of rise handlebars were implemented over the years, including Specialized own Venge Vias handlebar introduced in 2015. They were laughed at the time, as we were still in the “slam your stem” era.
Nowadays, integrated aerodynamic setups, such as the Tavelo Rise Cockpit, natively build 15mm to 25mm of clean, vertical rise directly into the carbon handlebar structure itself. This enables the stem to remain perfectly slammed and flush with the top tube (preserving a minimal frontal area profile), while positioning the brake hoods higher to support tilted forearms, narrower elbow tracking, and a relaxed, compressed spine.
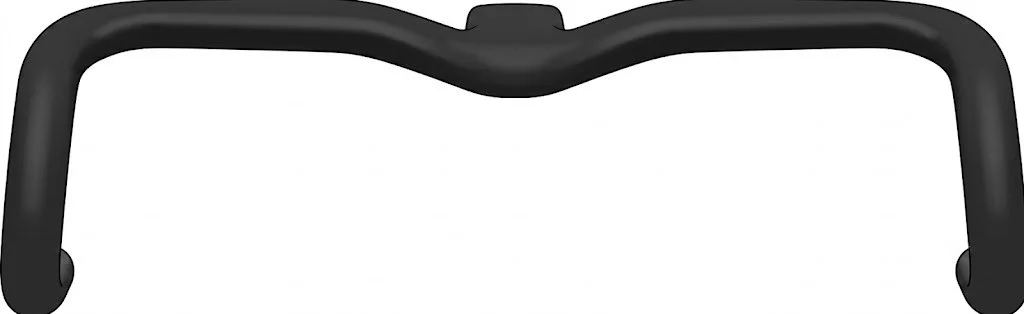
Example of a cockpit/handlebar with increased stack
METHODOLOGY
To rigorously evaluate the aerodynamic impact of cockpit height versus active anatomical adaptation, we focused our virtual wind tunnel testing on the AiRO Team's most aerodynamically challenging athlete: Joe, with his Men's Sprinter archetype (190cm, 85kg). Due to his muscular, broad-shouldered build, Joe experienced severe interaction drag penalties in our Part 1 handlebar width tests when forced to go narrow without positional modifications.
We executed a meticulous 9-stage geometric matrix on a simulated Mid-Tier Aero Road bike equipped with a Specialized Evade 3 helmet.
We systematically isolated variables across stack height increments (+4cm and +8cm), elbow tracking widths, reach extensions (+2cm, +4cm), and active muscular manipulation (scapular retraction and maximum upper-body shrugging).
DATA ANALYSIS: THE RESULTS
The data from our 9-stage matrix demonstrates that a geometric increase in stack and reach yields severe aerodynamic penalties if the athlete remains static. Conversely, when an increased stack and reach are intentionally utilized as a gateway to alter body posture, it allows the rider to morph into a significantly more aerodynamic silhouette, yielding extraordinary drag reductions.
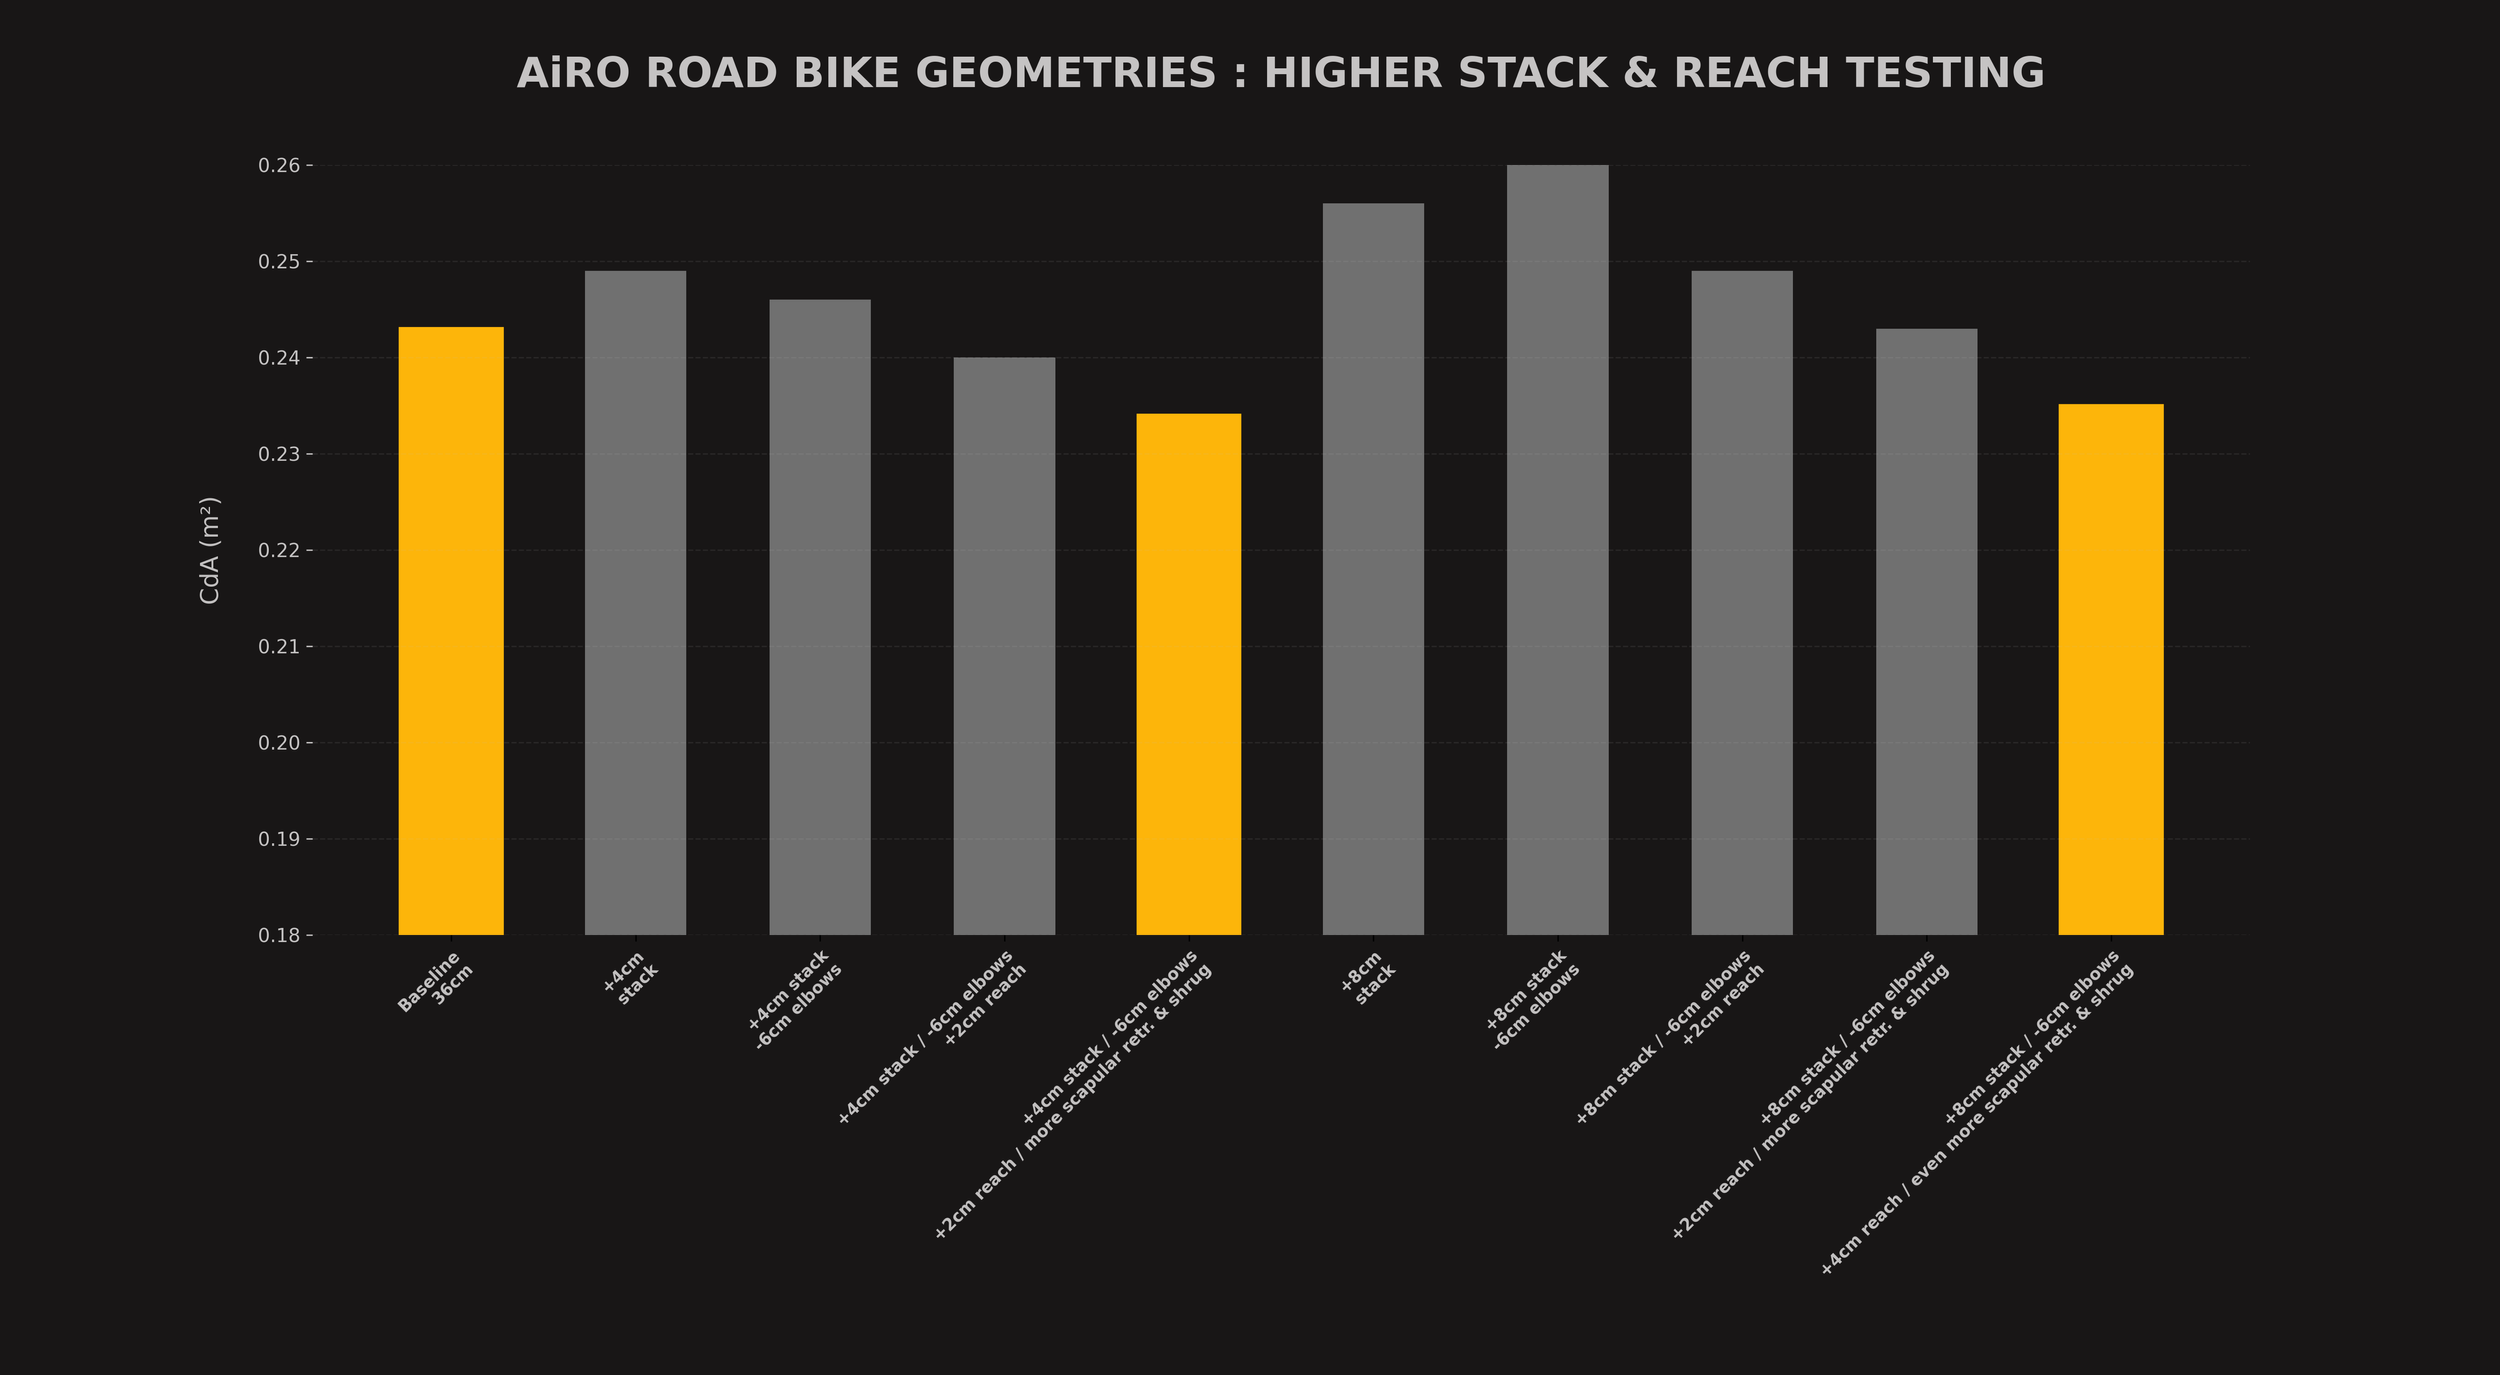
CdA evolution iterating from a low position to a higher & longer position
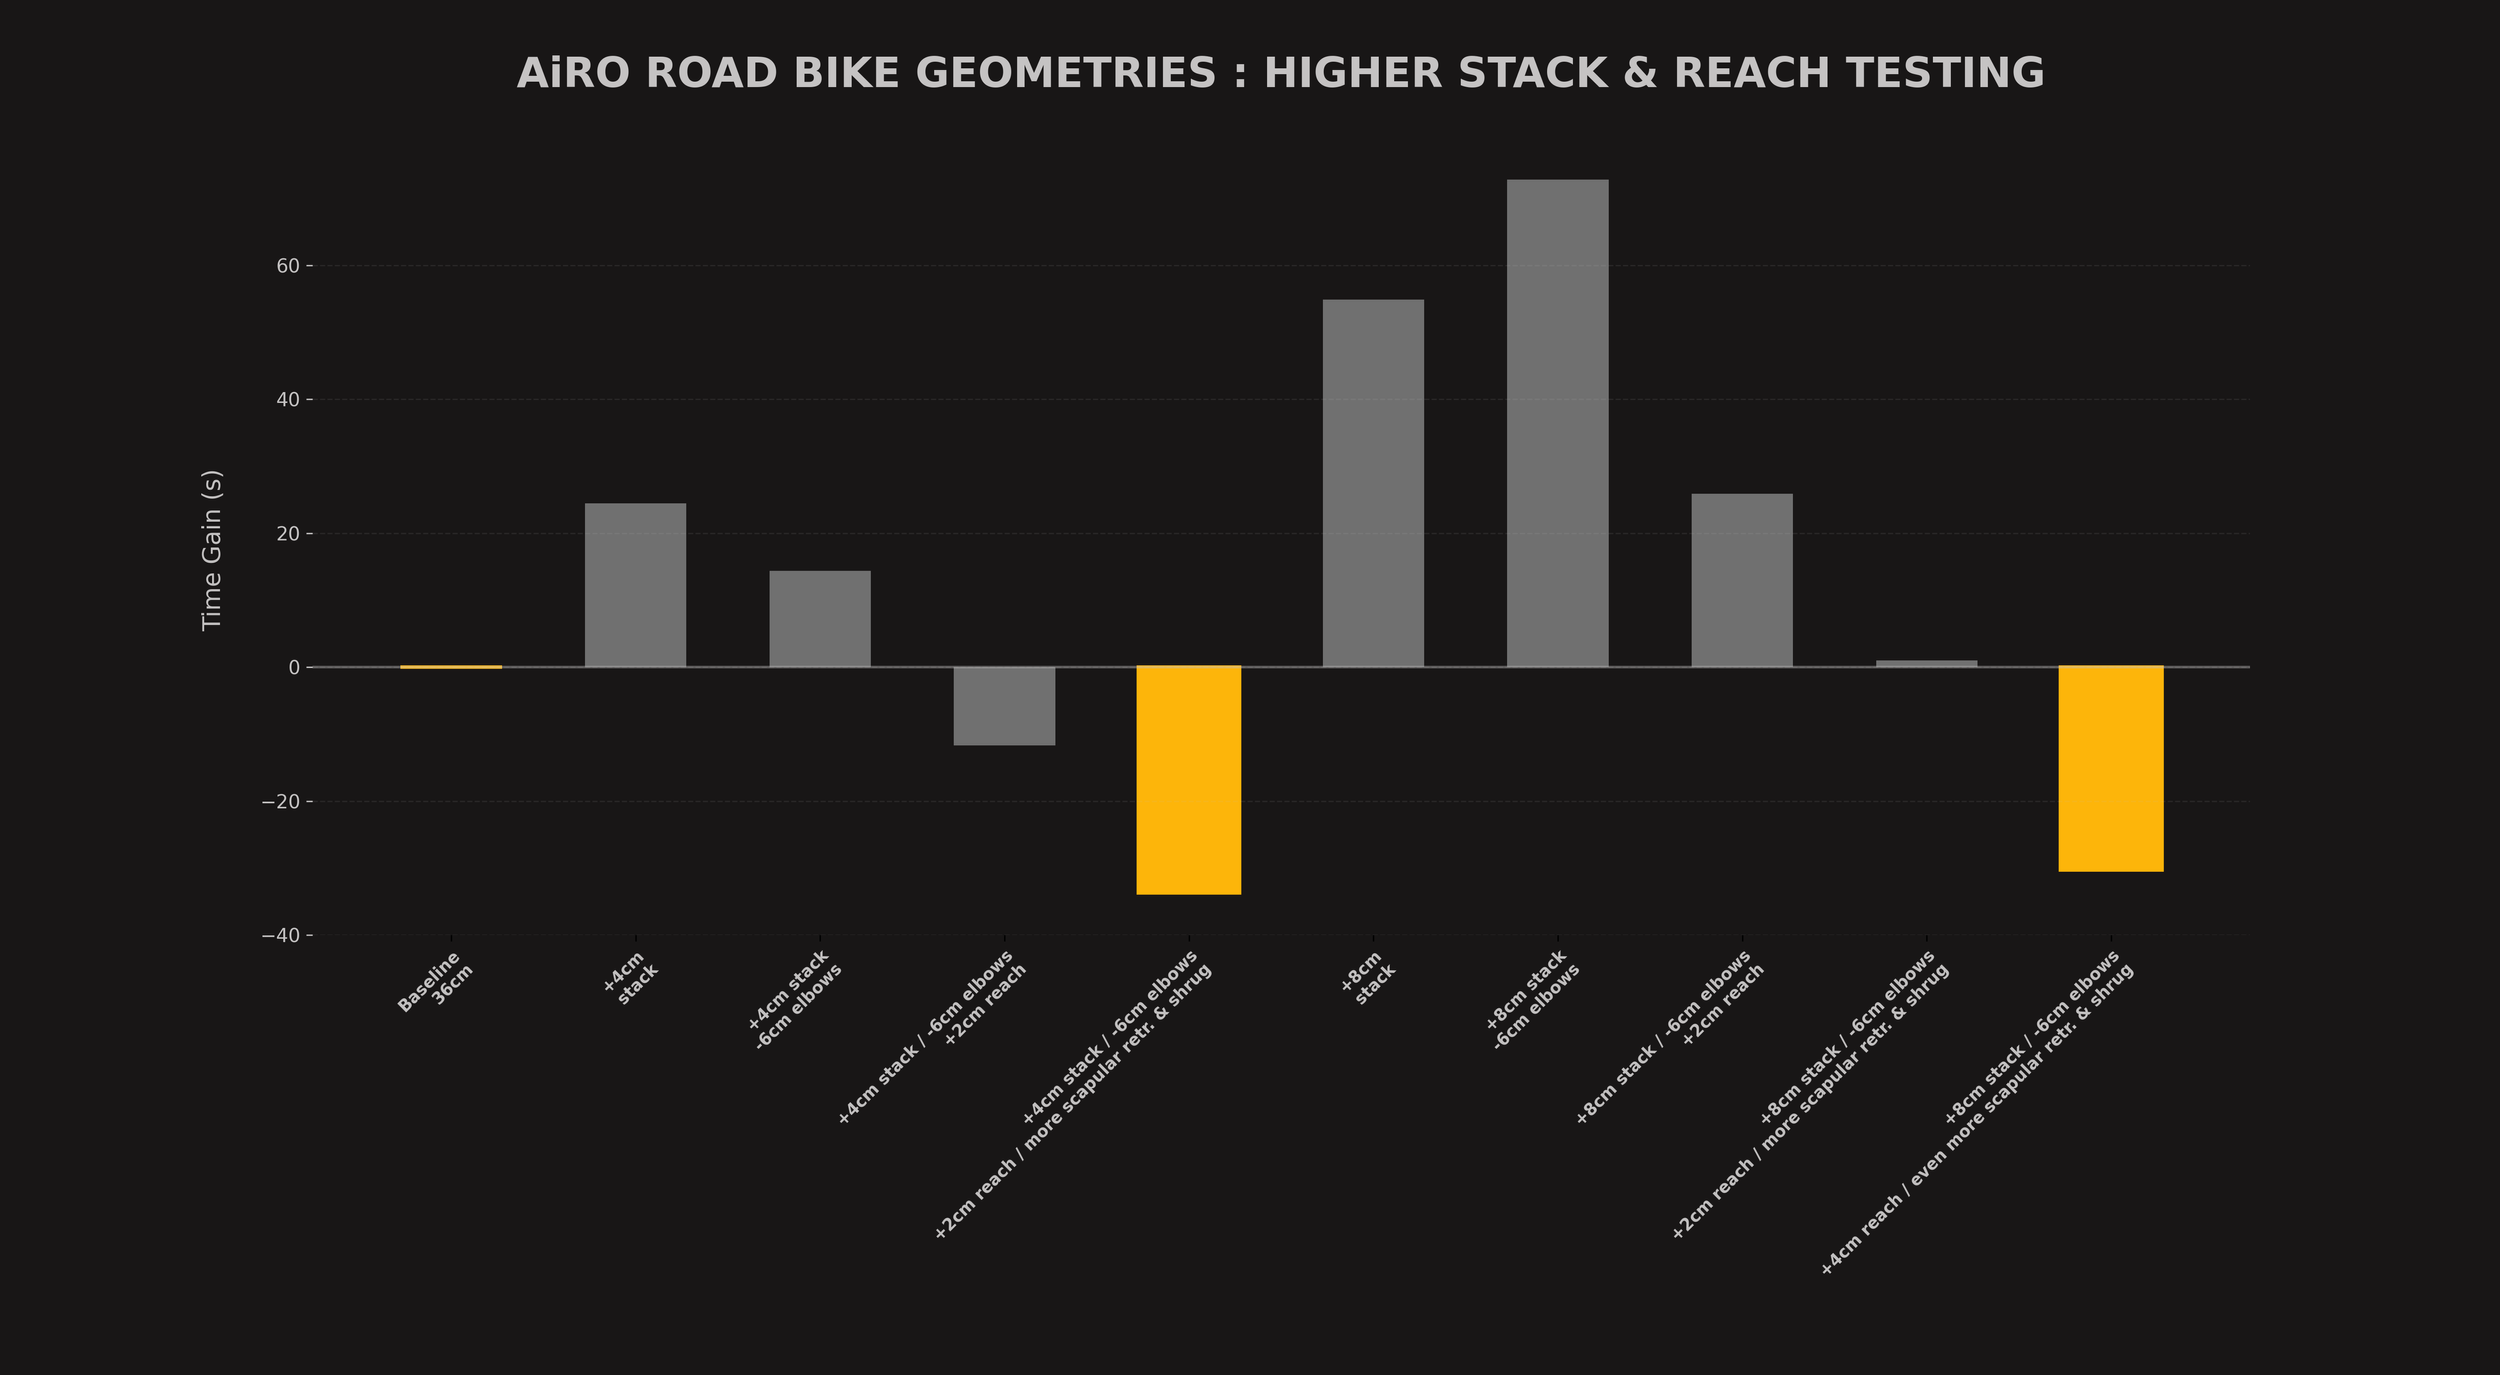
Times improvements over 40km iterating from a low position to a higher & longer position
The High-Stack Sail Effect (Tests 01 & 05): Simply raising Joe's stack height by 4cm or 8cm without modifying reach or posture increases his CdA to 0.249 and 0.256 respectively. Without changing how the body behaves, higher handlebars simply catch more oncoming wind.
The Elbow Narrowing Trap at Extreme Stack (Test 06): At an extreme +8cm stack, forcing the elbows 6cm narrower resulted in our worst measured configuration CdA at 0.260, 73 seconds. This shows that narrowing a rider's limbs when their torso is highly upright completely tears the boundary layer of airflow away from the lower back, resulting in a massive turbulent pressure wake.
The Postural Breakthrough (Test 04): The ultimate aerodynamic performance profile occurred at a +4cm stack height when Joe coupled an extended cockpit with active muscular manipulation. By elevating his hands, the static tension across his upper torso decreased sufficiently to execute a radical biomechanical shrug. This allowed his head to drop cleanly into the negative pressure zone carved out between his forearms, reducing his Coefficient of Drag area (CdA) to an incredible 0.234. This optimized structural layout completely shields the chest cavity and forces laminar airflow to route smoothly over the shoulders.
The Extremely optimized high stack position (Test 09): Remarkably, our simulations proved that aerodynamic efficiency does not automatically decay as the cockpit moves vertically upward. In Test 09, despite raising the handlebar stack to an extreme +8cm, which sits a full +4cm higher than our primary breakthrough position and +8cm higher than the baseline, Joe achieved a close second place in overall speed. By complementing this high-stack position with a +4cm reach extension and deep scapular retraction, his CdA was held down to an ultra-competitive 0.235, generating a substantial 31 seconds in time savings over a 40km course.
Technical Insight: The razor-thin 0.001 CdA delta between Test 04 and Test 09 is a revolutionary finding for bike fitters. It demonstrates that if a rider can successfully re-engineer their upper-body posture, they can achieve elite-tier aerodynamic drag reductions even when utilizing a dramatically higher, highly sustainable cockpit position. Front-end height is no longer the enemy of speed; it now provides new opportunities to associate maximum power output, sustainability all while being very aerodynamic.
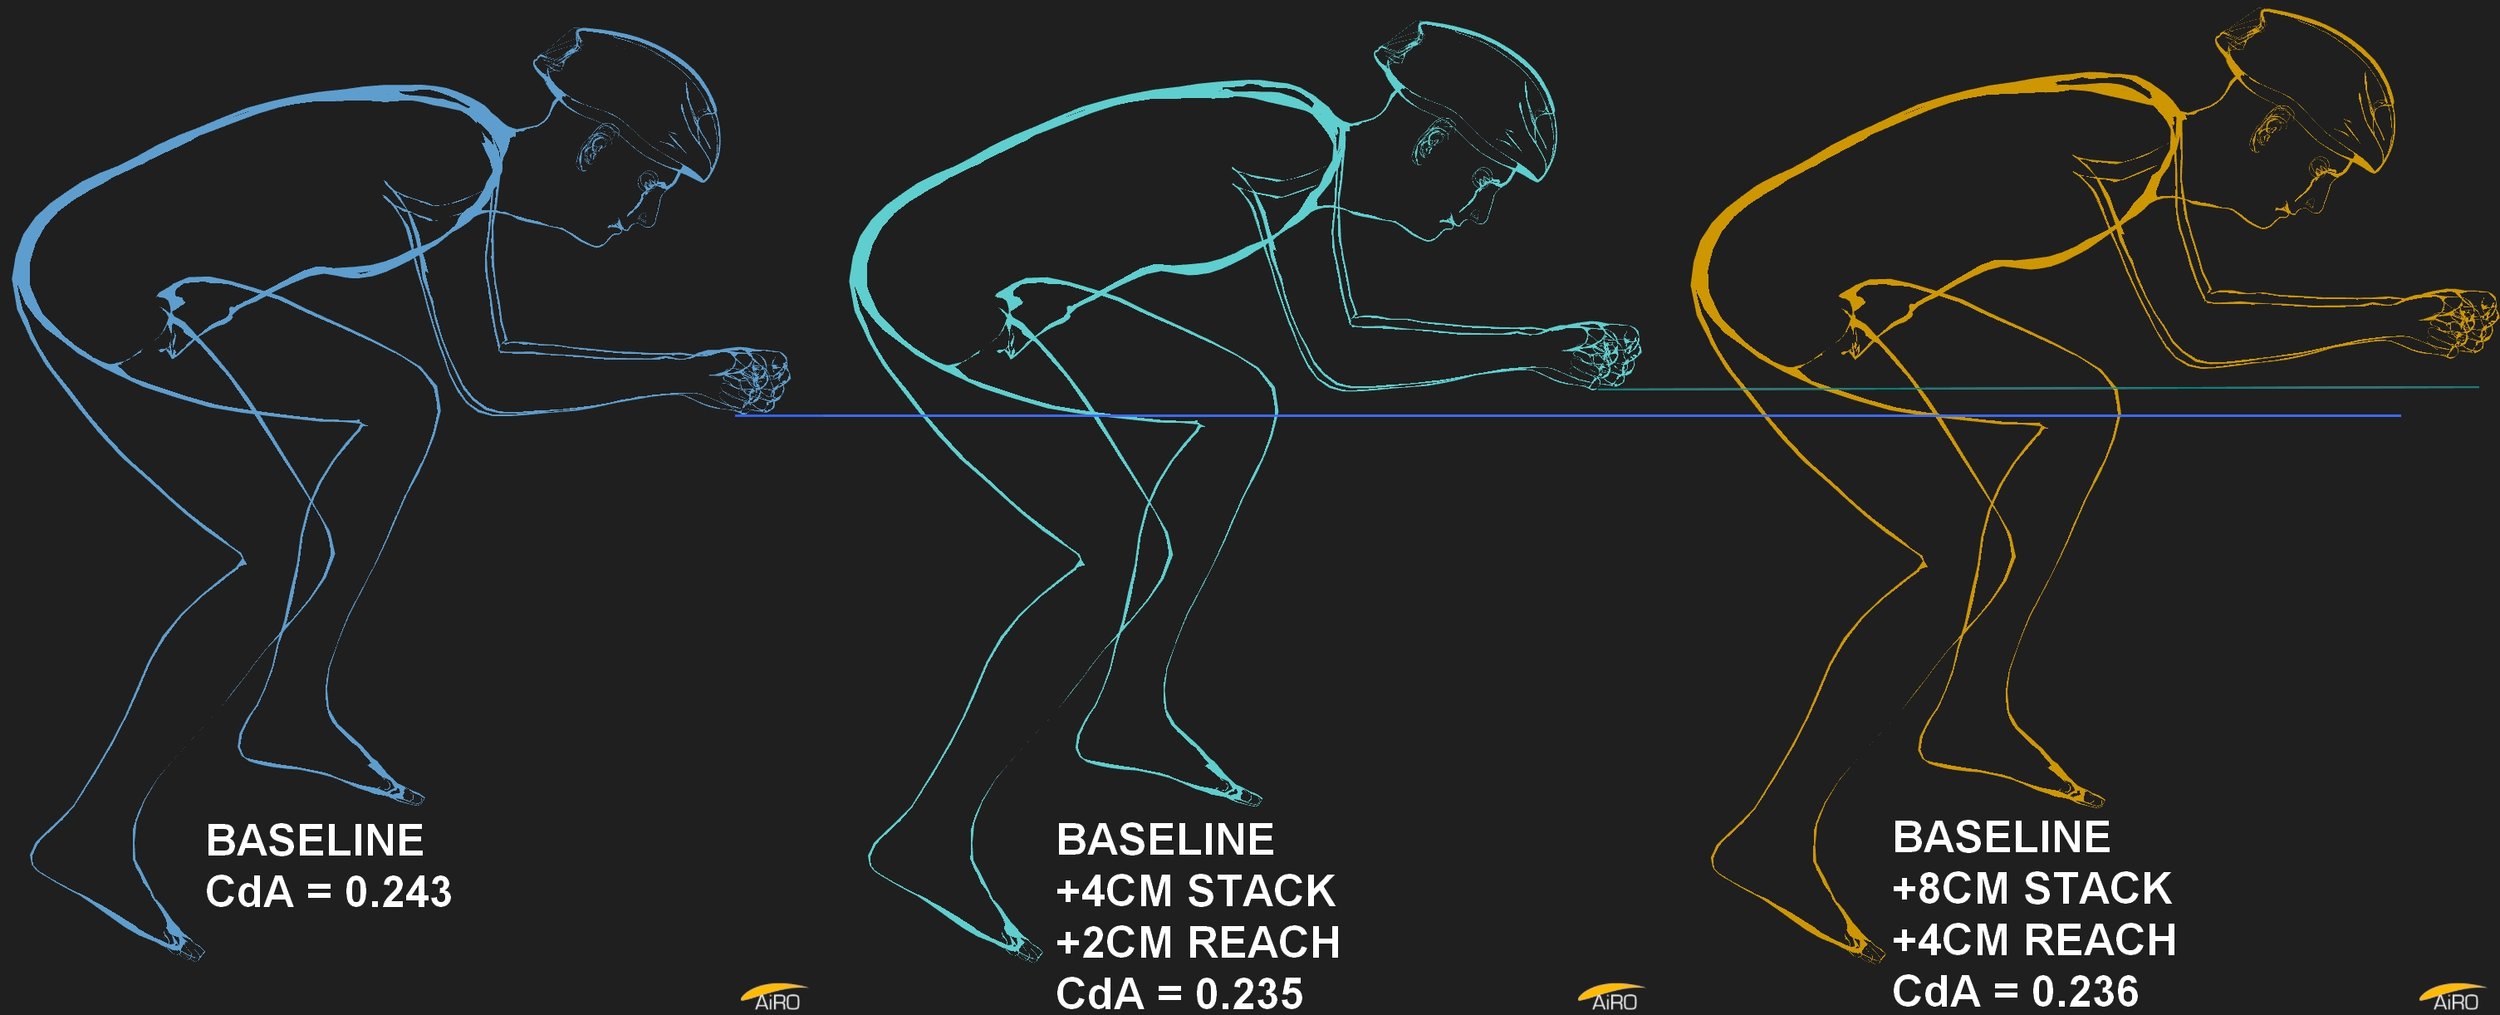
Baseline position (blue) / Fastest +4cm stack position (green) / Fastest +8cm stack position (yellow)
CONCLUSION: THE AiRO ADVANTAGE
The era of sacrificing biomechanical efficiency for a "theoretical" aerodynamic look is officially over. The data generated by AiRO proves that applying time trial positioning philosophy to standard road setups is one of the most effective ways to cheat the wind. Higher hands and a shrugged profile allow the rider to become a smaller, slicker object in the wind tunnel while keeping their lungs open and their legs producing maximum power.
HOW BIKE FITTERS CAN USE THIS DATA
For modern bike fitters, AiRO removes the guesswork from cockpit customization. Instead of guessing how many spacers to leave under a client's integrated handlebar, fitters can use the AiRO platform to:
Simulate the exact aerodynamic penalty or gain in order to define a customer’s handlebar stack before cutting a fork steerer tube or ordering a different cockpit.
A/B test a rider's ability to shrug across different handlebar reaches and drops.
Protect Power Delivery: Optimize your client's front-end height to preserve their hip angle while tracking their drag reductions step-by-step, ensuring comfort never compromises speed.
Stop slamming. Start simulating.
NARROWER HANDLEBARS ON ROAD BIKES, PART 1
INTRODUCTION
Going narrower is all the rage right now, except for Mathieu Van Der Poel who, in a recent interview, explained he is keeping his usual handlebar width as it helps him push more power. Considering the amount of power this champion can push, it would be hard to contradict him. The trend went so far that for 2026, the UCI had to create new rules to ensure handlebars would not go narrower than 40 cm at the drops (outside-to-outside dimensions) and that it would not be possible to angle the shifters in a "crazy" way, with a limit of 28 cm internal dimension between both shifters.
While narrowing road handlebars seems obvious on paper, there was no simple way to validate the gains being promoted without doing wind tunnel or field testing. Neither of these are easy to organize, as repeatability is difficult to ensure and the process is time-consuming with integrated cable housings and varied setups.
With AiRO, we can finally test as many handlebars as we want on as many body shapes as we want, with the exact rider positions we desire.
METHODOLOGY
In order to test aerodynamic theories, we had to create our own team: the AiRO Team. We "hired" four women and four men with vastly different physical characteristics to ensure our results aren't just anomalies of a single body shape. This diverse group allows us to see how wind interacts with different shoulder widths, torso lengths, and muscular builds.
Meet the AiRO Team (Our 8 Permanent Members):
AiROn: 176 cm, 67 kg (Men’s GC Leader). Lean and balanced.
ANNA: 169 cm, 58 kg (Women’s GC Leader). Compact and efficient.
CHRIS: 172 cm, 60 kg (Men’s Climber). Slender and light.
CLAIRE: 180 cm, 70 kg (Women’s Sprinter). Tall and powerful.
JOE: 190 cm, 85 kg (Men’s Sprinter). Broad-shouldered and muscular.
LAUREN: 165 cm, 63 kg (Women’s Allrounder). Sturdy "Rouleur" build.
SARAH: 158 cm, 47 kg (Women’s Climber). Extremely petite.
TOM: 182 cm, 75 kg (Men’s Allrounder). Standard high-performance profile.
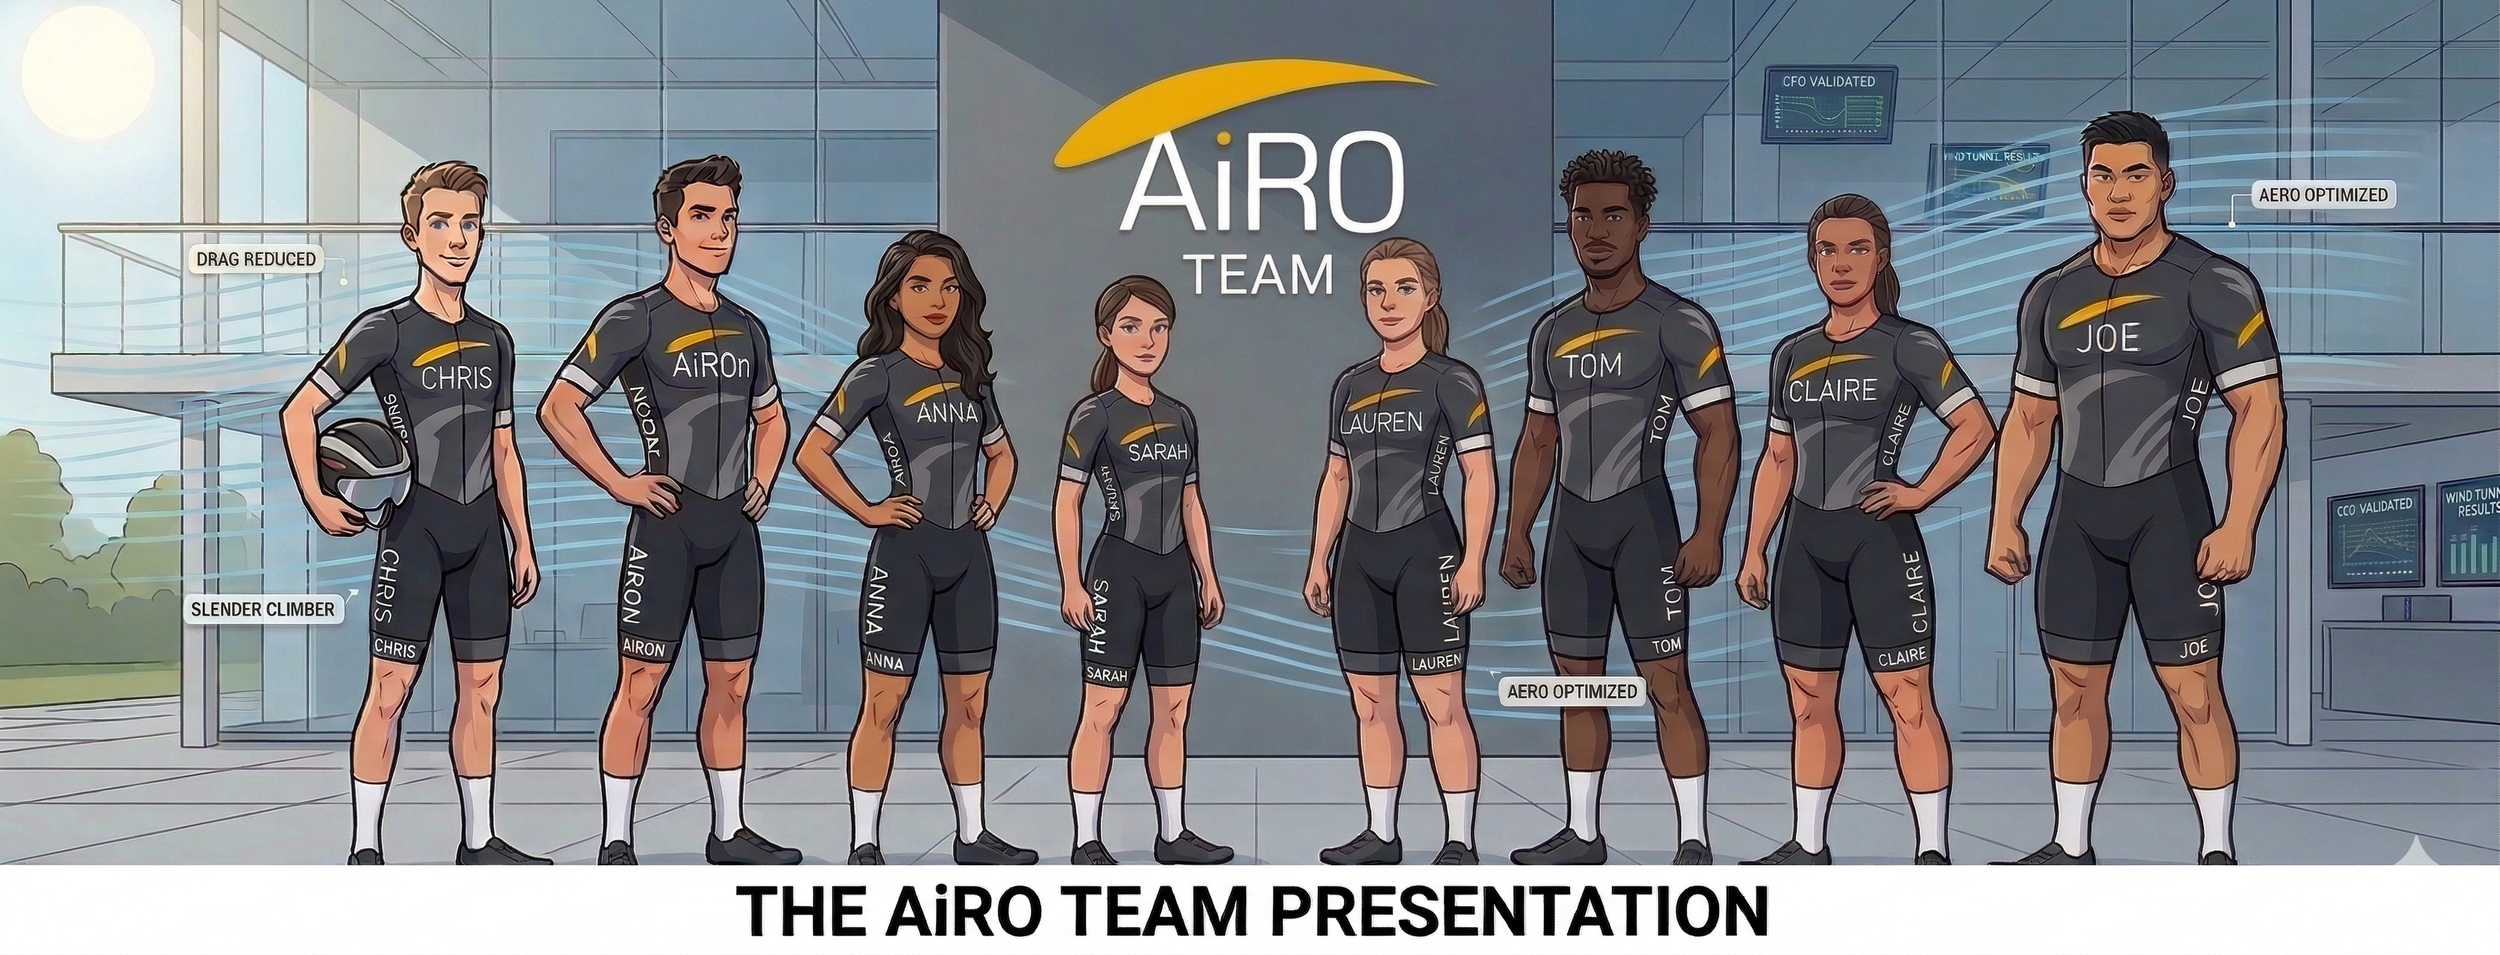
For this Part 1 study, we analyzed 32 configurations (8 riders x 4 handlebar widths : 42, 40, 38 and 36 cm. All simulations utilized a Mid-Tier Aero Road bike and a Specialized Evade 3 helmet.
We operated under a key assumption: hands and elbows remained aligned as the width narrowed. While some cyclists may struggle to adapt—resulting in "flared elbows"—we established this alignment as our baseline for Part 1 to isolate the aerodynamic effect of the handlebar itself and the subsequent narrowing of the rider's frontal silhouette.
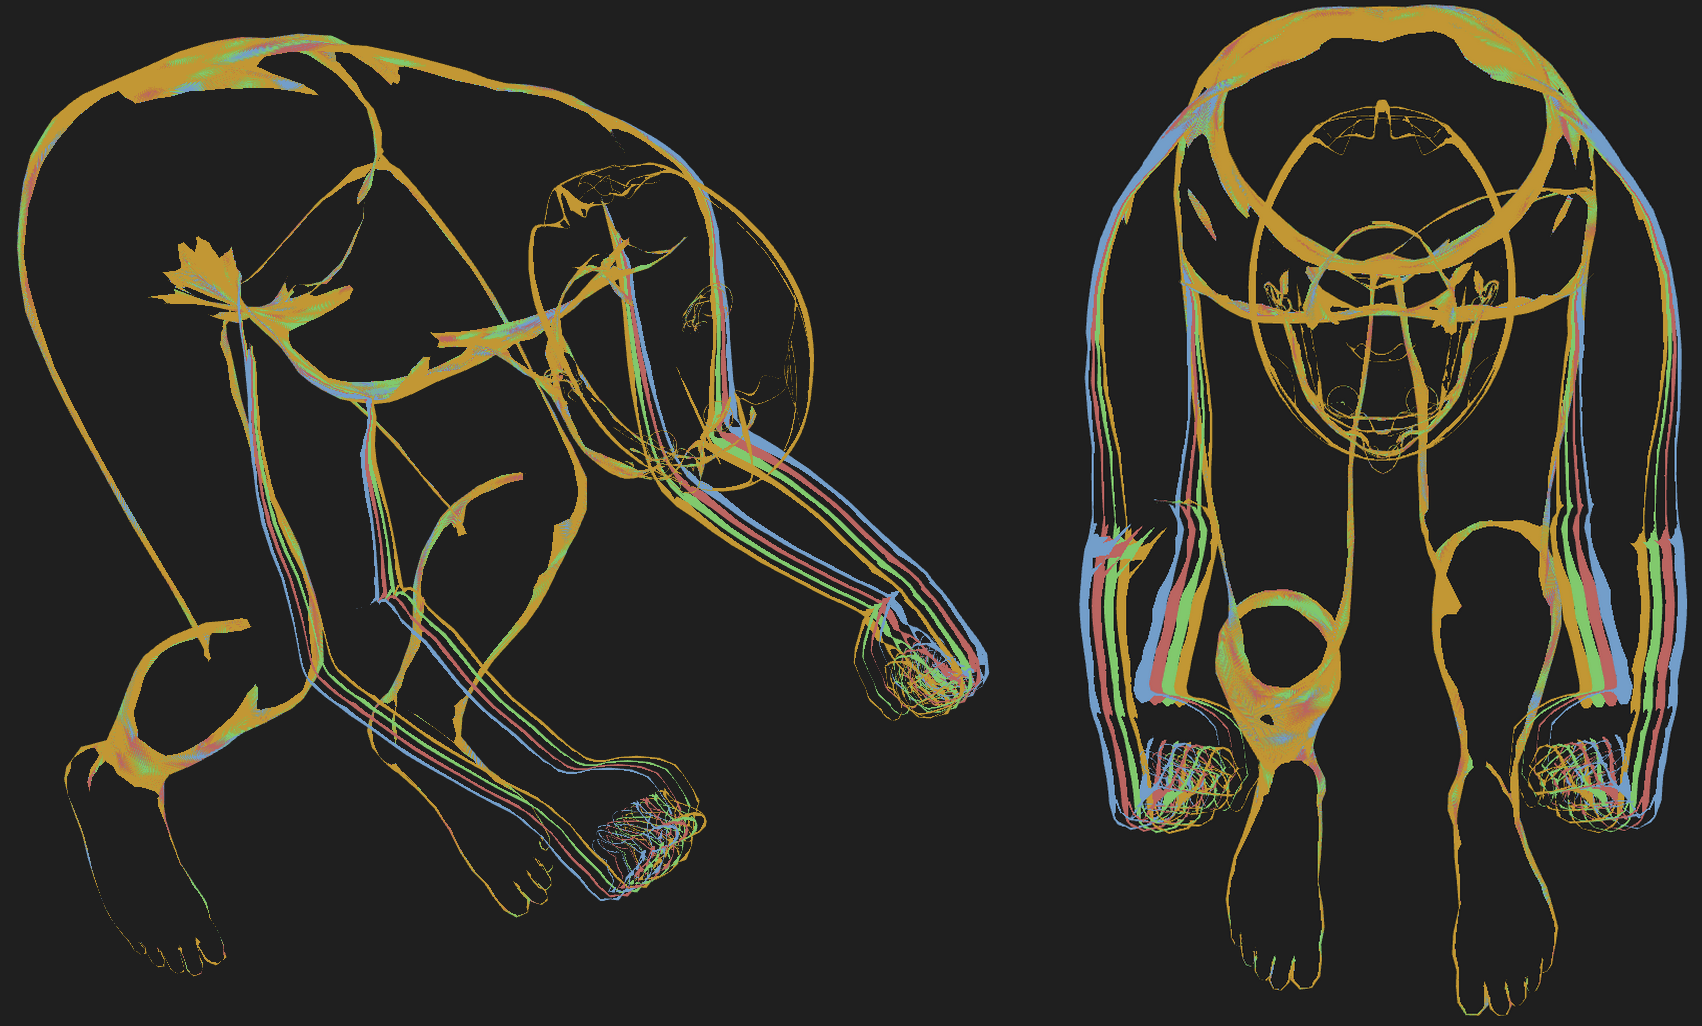
HANDLEBAR WIDTH CHANGE - IMPACT ON THE CYCLIST, EVERYTHING ELSE BEING EQUAL
DATA ANALYSIS: THE RESULTS
Aerodynamics is often described as the "invisible science," where marginal gains are hidden behind the complex interactions of air pressure and turbulent wakes. To unveil these mysteries, we processed our 32 configurations through the AiRO simulation engine, generating a high-fidelity map of the aerodynamic fingerprint for each rider profile.
The primary metric of our evaluation is CdA (the Coefficient of Drag multiplied by Frontal Area)—the ultimate indicator of how much wind resistance a rider must overcome. While the industry "rule of thumb" suggests that narrowing the handlebar always leads to a linear reduction in drag, our data reveals a far more nuanced reality. By stripping away subjective "feel" and replacing it with precise CFD metrics, we can see exactly where the air flows smoothly and where the equipment begins to clash with the athlete's anatomy.
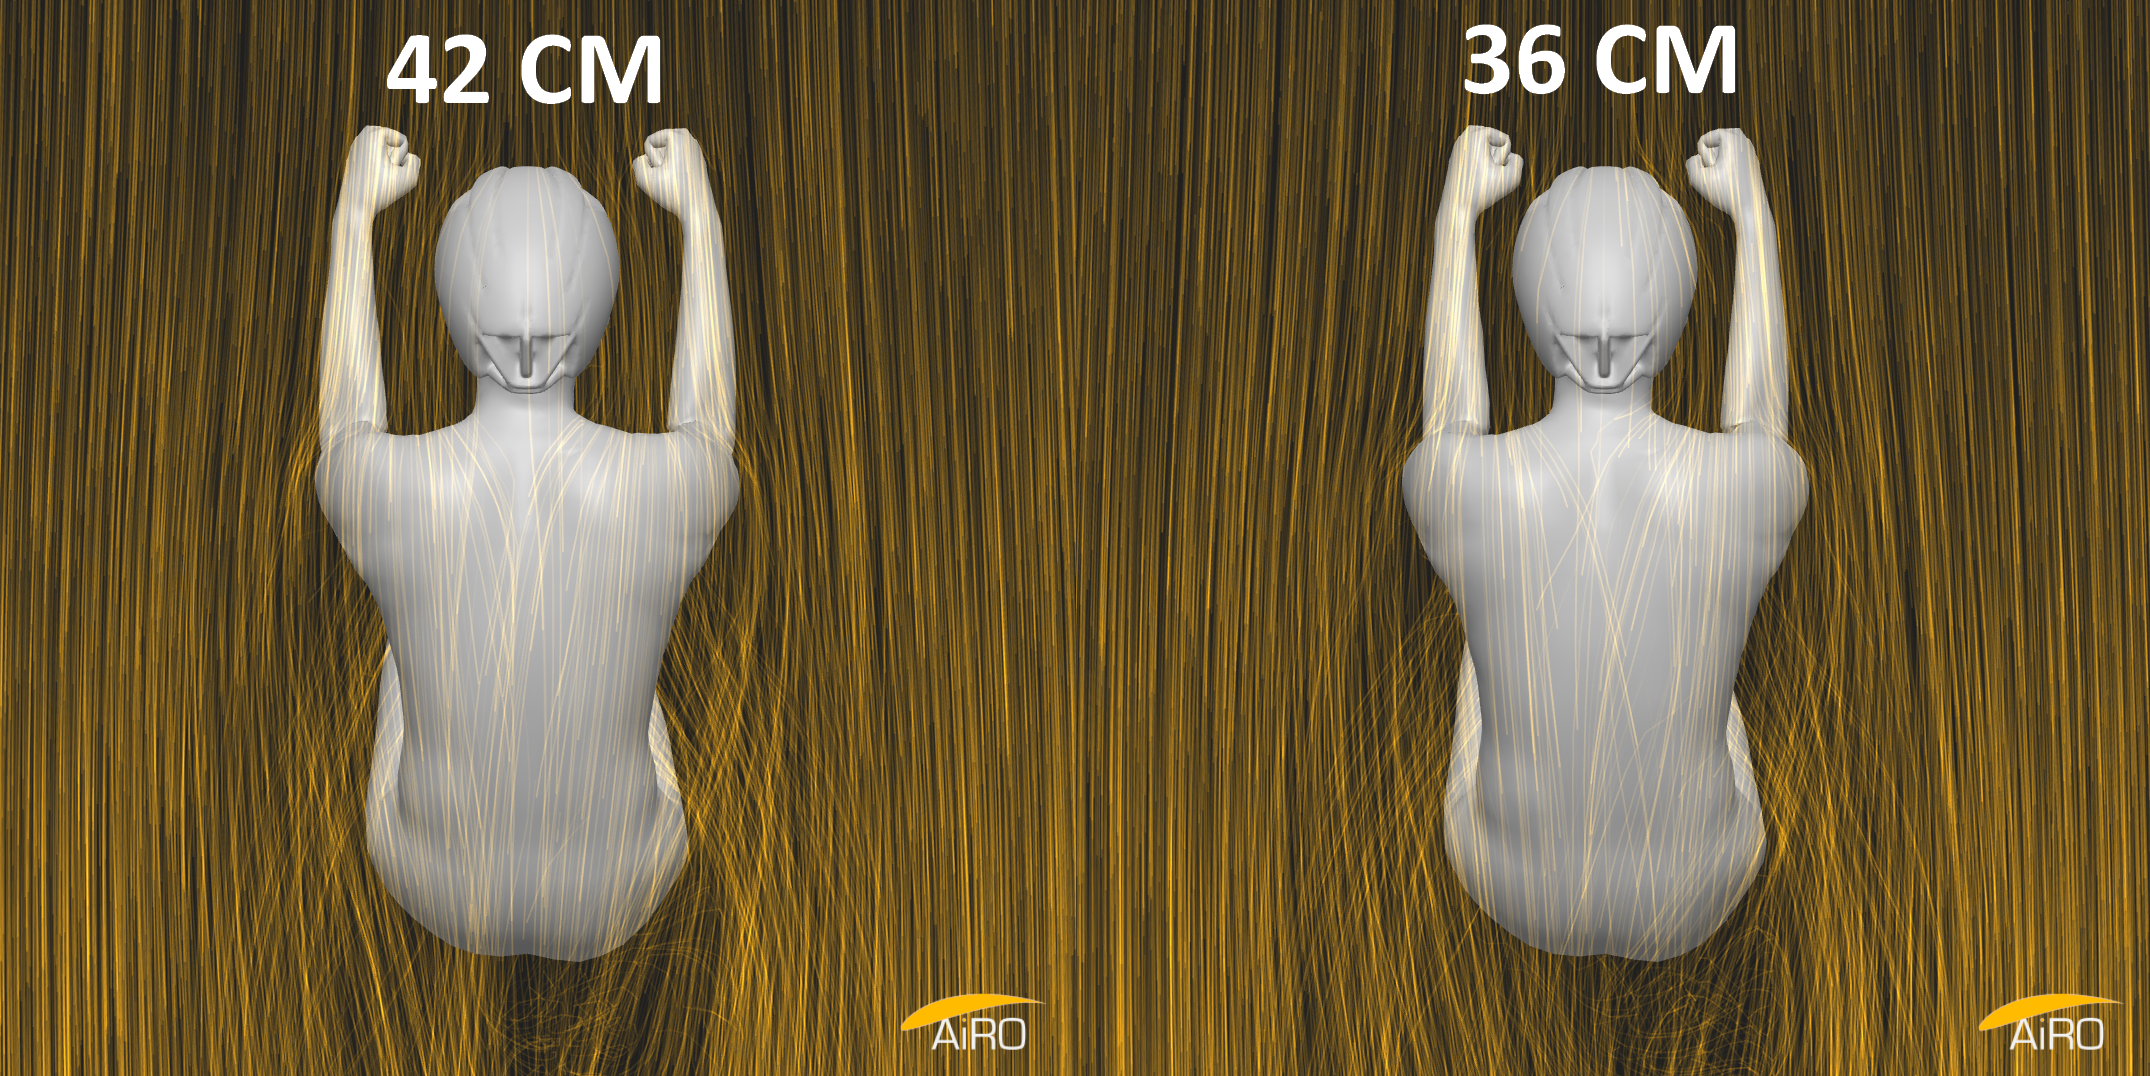
CFD TOP VIEW : ONE CYCLIST, MAXIMUM AND MINIMUM WIDTH TESTS
Below, we break down the performance matrix. For some of our riders, the digital wind tunnel confirmed the "narrower is faster" hypothesis; for others, the results uncovered aerodynamic "clashes" that would have remained invisible without high-level simulation.
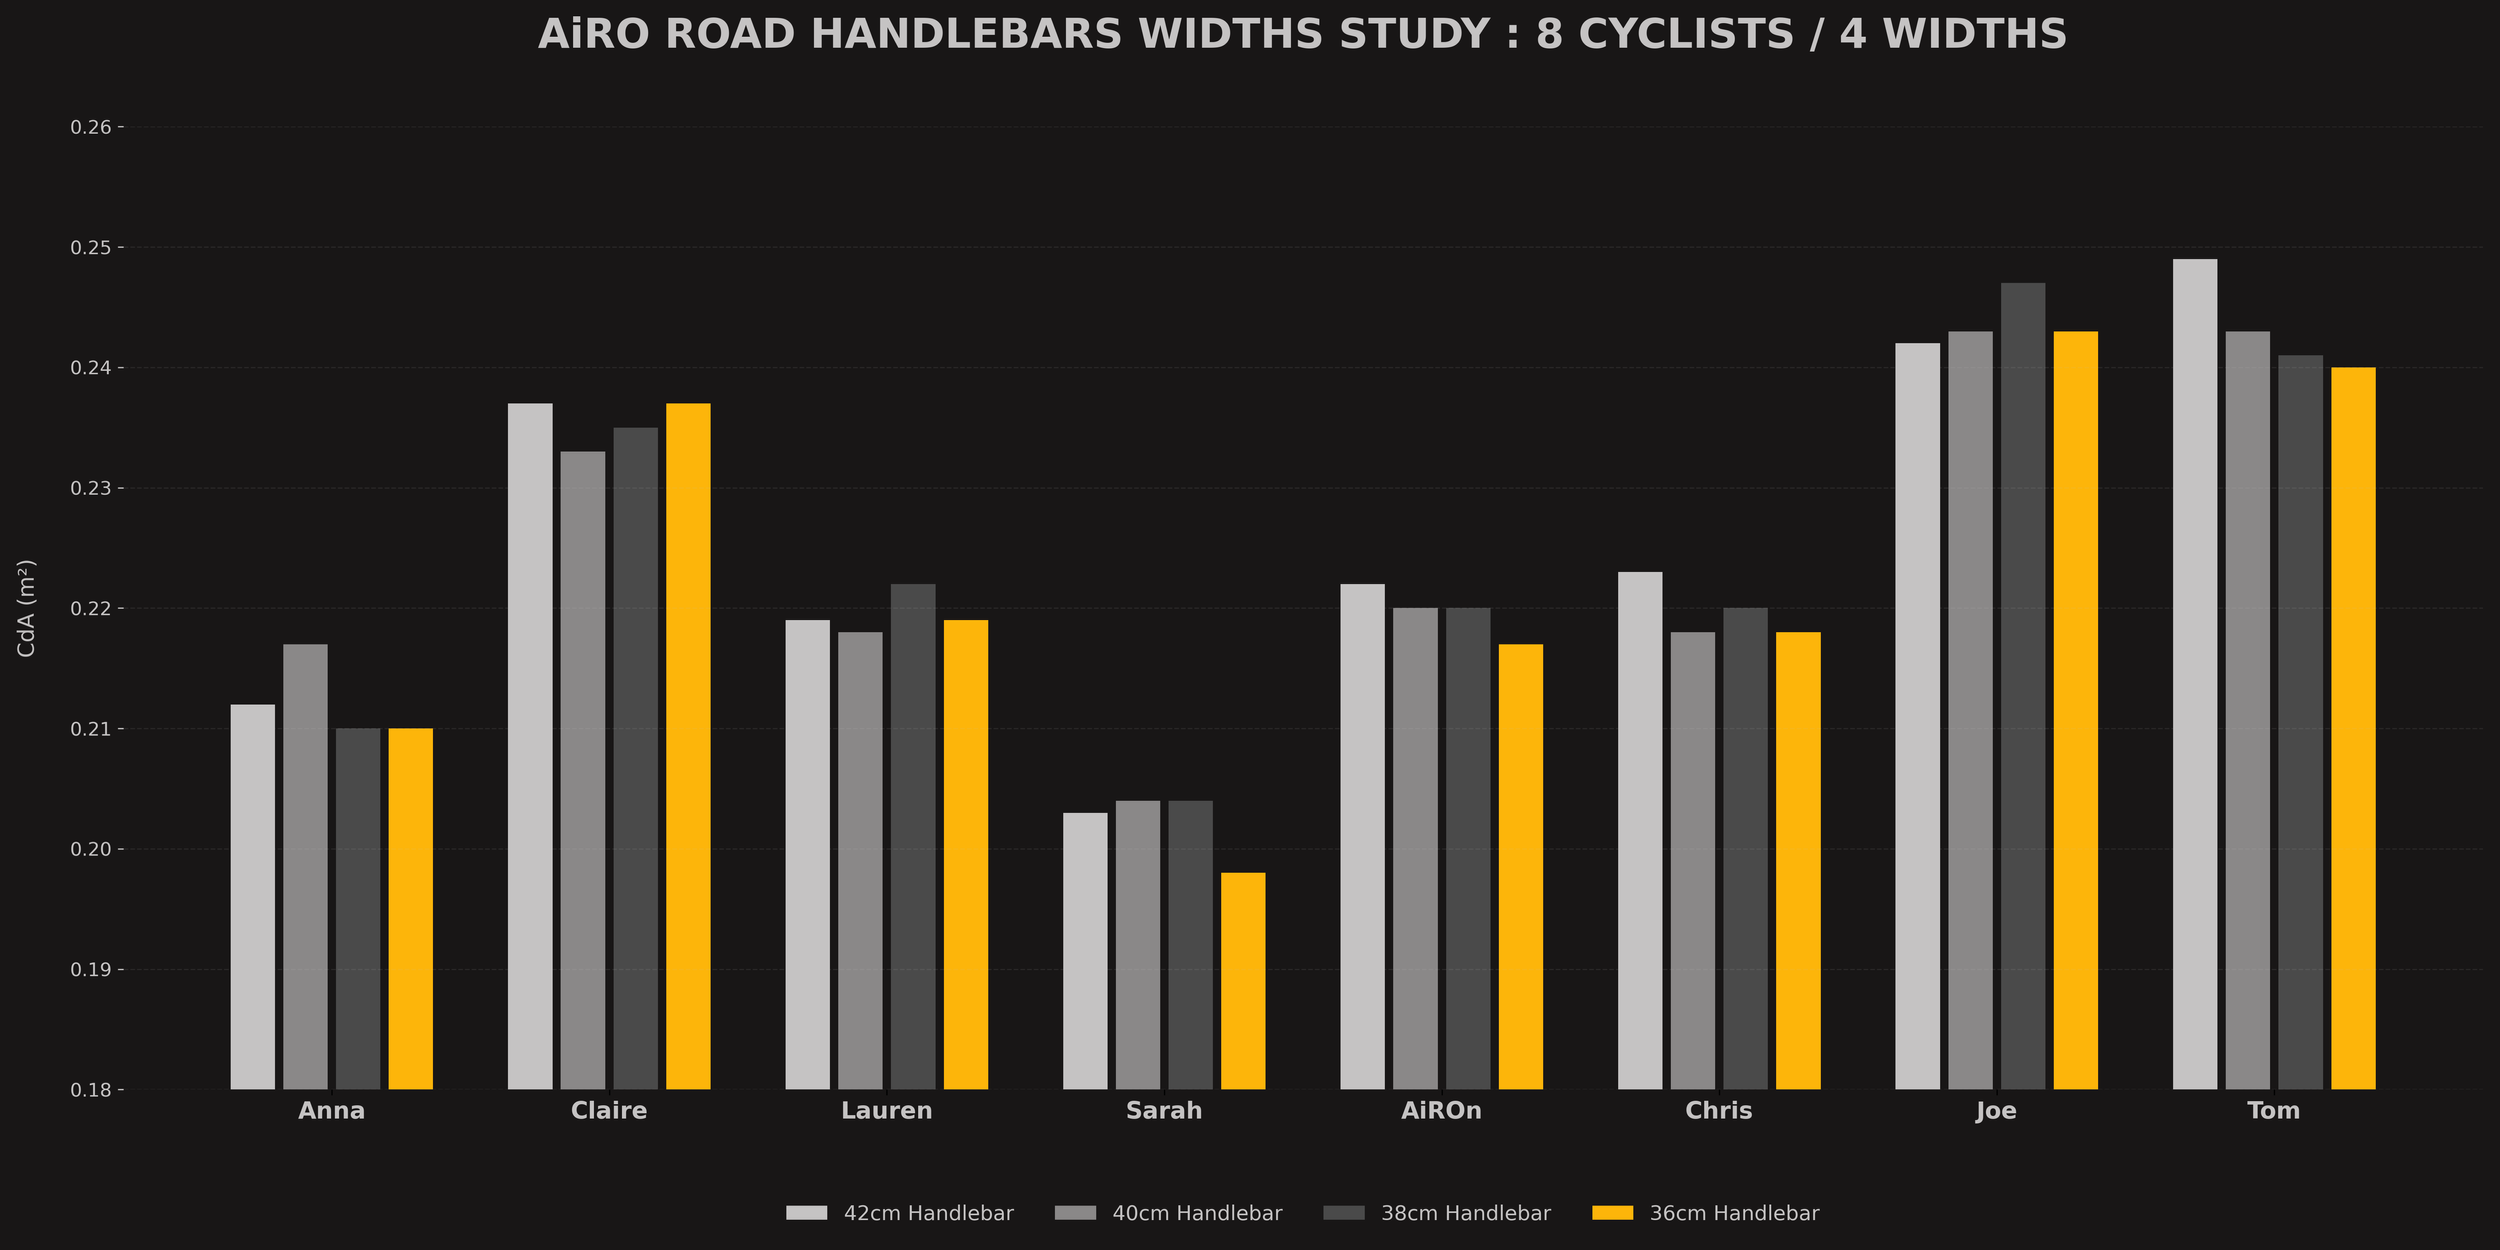
COMPARING HANDLEBARS RANGING FROM 42 CM TO 36 CM ON 8 DIFFERENT CYCLISTS
When we look at the results, three distinct stories emerge:
The Silhouette Advantage: For riders like Tom, Sarah and AiROn, narrowing the bars effectively pulls the arms inside the "wind shadow" of the torso. This results in a near-linear reduction in CdA, leading to the massive 8 Watt savings Tom observed at 40km/h.
The Interaction Clashes: In the cases of Joe and Anna, we see "spikes" in drag at specific widths (38 cm for Joe and 40 cm for Anna). This occurs when the arms are positioned in a way that disrupts the airflow over the hips or legs, creating localized turbulence that outweighs the benefit of a narrower frontal area.
Sprinter bodies: Both sprinters in our Team (Claire and Joe) show little to no benefit when going to narrower handlebars, indicating that if they can achieve a higher sprinting power with a wider stance, the aerodynamic trade-off is virtually non-existent.
When we analyze Joe, our largest rider (190 cm}, 85 kg), his CdA actually peaked at 0.247 when using 38 cm bars, which is a significant penalty compared to his 0.242 baseline at 42 cm. Similarly, Claire (180 cm, 70 kg) ended her test at 36 cm with a CdA of 0.237, exactly where she started at 42 cm.
From an engineering perspective, this suggests a "saturation point" for wider-shouldered, muscular athletes. As the hands move inward, the muscular volume of the shoulders and chest is forced to "bunch up," potentially increasing the complexity of the airflow around the torso and creating interaction drag that negates any reduction in frontal area (A). For these athletes, the leverage and thoracic expansion provided by a 40 cm or 42 cm bar likely offer a significant wattage-production advantage without an aerodynamic penalty. In the world of elite sprinting, where peak power is measured in the thousands of watts, sacrificing biomechanical leverage for a "theoretical" aero gain that the data proves doesn't exist for their body type would be a strategic error.
THE AiRO ADVANTAGE
This data highlights why "eyeballing" aerodynamics is a recipe for wasted watts and money. Aerodynamics is the result of a complex interaction between the equipment and the human body. Narrowing your handlebars might save you nearly 12 watts at 45 km/h (like Tom), or it might actually cost you time (like Joe).
AiRO provides the definitive answer by simulating these interactions with engineering precision, allowing you to validate a position before ever turning a bolt or cutting a cable.
OPEN TO FURTHER TESTING: PART 2
While these results show a general trend toward narrower being faster, we acknowledged a major limitation: we assumed perfect elbow-to-hand alignment. In the real world, many riders lack the flexibility to maintain this, leading to elbows poking out into the wind as the hands move inward.
In PART 2, we will dive down the "rabbit hole" of biomechanical adaptation. We will test what happens when the elbows flare out, or on the other hand what happens when cyclists can actually get them in, and how different shifter angles (within the new UCI 2026 limits) affect the overall drag coefficient.
STAY TUNED…
Benchmarking Report #1
We compare AiRO to our own wind tunnel testing and discuss the peer-reviewed academic literature it is based on.
Download our Benchmarking Report here
Overview:
This is our initial benchmarking report for Digital Aero Twin Technology. It was completed as part of the USOPC Tech and Innovation Grant. Since the technology behind AiRO is used across different speed sports, a range of poses representing those sports was chosen, not just cycling. We will continue benchmarking our approach across specific test cases and applications and document our research in future reports.
Goals / Approach:
Our goal is to make sure our riders are faster on race day. It is critical that the recommendations made by AiRO are transferable to the real world. Additionally, we want to be fast, easy to use and affordable, because we believe that the exploratory, wide-scale testing, AiRO unlocks can provide a significant additional performance gain and that more affordable testing can reach more people.
To specify our accuracy needs, and consider any tradeoffs between accuracy, speed and ease-of use, we focused on what is required for AiRO to be useful. To be faster on race day, athletes need to select the best position. This leads to the following order of priorities:
The software needs to rank positions correctly. Given two positions with different drag, the software needs to accurately recommend the one with lower drag. The ability to correctly rank positions is more important than getting the exact numbers right, but of course the ability to rank positions correctly depends on the magnitude of difference between them. Our goal is to be able to discern positions that could also be discerned by an expertly executed wind tunnel or drag test on an experienced athlete. From experience we consider that a best achievable repeatability in wind tunnel tests with live riders is around ±0.5% (1SD), world class is ±1%, experienced riders can achieve 2% repeatability, and novice tunnel testers 3%.
The software should be able to estimate the magnitude of the aerodynamic benefit of a position change to within ±20% of the difference, for a substantial difference of 0.005m2 or more. Implementing a change recommended by the software has a cost, either in the time and effort to adapt to the new position, or the financial cost of acquiring a new helmet or the required fit components to make the new position work. To understand if the effort is worth the benefit, the software needs to get the magnitude approximately right, but it does not need to be exact.
The absolute numbers are less actionable than the relative numbers but might be used to inform pacing strategies and to compare to wind tunnel, track tests or other athletes. Since we don’t simulate the bike and utilize a user-supplied estimate of the drag value of the bike, this puts an upper limit on how accurate we can report absolute values. Different wind tunnels deal with blockage, fixture drag, flow uniformity and turbulence intensity differently, so the absolute numbers are bound to vary from tunnels as well.
We aim to get absolute numbers within 5-10% of tunnel values.
In the long run, AiROs true validation will be if riders use it successfully to find faster positions and go on to win races. And we are off to a great start. Our first partner, the US Speedskating Team Pursuit Team was able to identify hone their technique using AiRO, culminating in a World Championship win in dominant fashion. Another partner of ours was able to make a critical equipment decision based on data that would not have been able to be delivered with conventional testing methods, and velodrome testing later confirmed the advice.
To make AiRO as accurate as possible we looked at academic, peer-reviewed literature and conducted our own wind tunnel benchmarking.
Literature Review and Simulation Approach
After reviewing more than a dozen papers for their methodology, applicability and findings, we settled on two papers as the most valuable to guide our approach.
“CFD Analysis of cyclist aerodynamics: Performance of different turbulence modelling and boundary-layer modelling approaches.” By Thijs Defraeye, Bert Blocken, Erwin Koninckx, Peter Hespel and Jan Carmeliet was published 2010 in the Journal of Biomechanics. It includes a wind tunnel validation on a 1:2 scale model, high resolution pressure measurements for correlation and studied the effect of varying CFD modeling parameters on simulation accuracy.
“CFD simulations of cyclist aerodynamics: Impact of computational parameters” by Thijs van Druenen and Bert Blocken was published in 2024 in the journal of Wind Engineering and Industrial Aerodynamics it includes a thorough literature on the topic of CFD simulation around the human body, followed by a detailed parameter analysis that was benchmarked against expertly executed wind tunnel tests.
The key findings in both papers were that well executed CFD studies can find good agreement with wind tunnels, but the exact selection of simulation parameters, turbulence and wall modelling approaches, matters.
Simulation approaches that selected unsuitable turbulence models, or too coarse mesh parameters can be off by as much as 25%, rendering the value of those simulations minimal or even counterproductive.

Adapted from Blocken 2024
The SST k-ω model, without wall models, and appropriately selected wall parameters matched the absolute wind tunnel measurements within 6%. Models with additional terms dealing with laminar-turbulent transition can further reduce the measurement error and reach mean errors of 0.9%. Both reported the absolute errors relative to wind tunnel tests.
In developing our simulation approach for AiRO, we first replicated the most accurate simulation recipe outlined in the paper, then tuned the simulation for speed and affordability. We did this by reducing the numbers of iterations required to convergence by utilizing a good initial estimate of the flow field, tuning relaxation factors, and locally adjusting the mesh resolution on the surface and in the volume. We also take care to select the most performant hardware solution for our simulation problem and optimized our code for the specific hardware.
Currently, we have chosen the k-ω model over the T-SST, and increase reported drag by 5%, since most literature and most of our own testing indicated a consistent under-reporting of drag by this simulation approach by that magnitude. (See next chapters)
We made the decision to forego a transition model since the k-ω model has been validated within dozens of papers, while the T-SST approach is more novel, and has less track record. Tuning the additional parameters related to transition adds additional uncertainty. We intend to pursue a T-SST model once we can validate the approach in additional wind tunnel tests and offer it at a speed and cost that would work for our target users.
Wind Tunnel Benchmarking
In Spring 2024, we tested 30 positions in the wind tunnel and in AiRO to get an initial indication of the agreement between the wind tunnel and simulation. We used the same approach to create our Digital Aero Twin as is available to our users. Since the AiRO team is serving more speed sports than cycling and triathlons, we chose to represent a range of positions, representing cycling, speedskating, running and skiing. The athlete was standing in the test section, no bike was present. We plan to do more cycling specific validation tests in the future.
The tests were conducted at A2 wind tunnel. The test was wearing a whole-body skintight skinsuit with textured arms and legs.
The results of this test can be seen below:

Drag values of wind tunnel testing and CFD compared.

Correlation between CFD and Wind Tunnel Test
Wind tunnel and CFD positions showed a correlation coefficient of R^2 = 0.9987.
After accounting for a systematic scaling factor, the mean variance of the two datasets is 2.3%. Some of the disagreements between wind tunnel and CFD come from inaccuracies of the CFD approach, some of the inaccuracies of the wind tunnel. For the wind tunnel, the main source of error is random variation based on the ability of the test athlete to hold the position.
If we assume a world class testing accuracy of 1% for our test athlete, this would indicate an accuracy of 2% for AiRO. If we assume our tester met repeatability values more in line with experienced, but not world class testers, AiROs random error would be around 1%.
Our validation analysis revealed a systematic scaling difference of 24% between wind tunnel measurements and CFD simulations, with CFD consistently predicting lower values. This scaling factor remained consistent across tests, as evidenced by a very high correlation coefficient (R² = 0.9987) between the datasets. The strong linear relationship indicates that while absolute values differ, relative trends are preserved with high fidelity.
On the same day, we conducted testing with an athlete for whom we possessed track performance data. This comparative analysis showed that the wind tunnel measurements diverged from track data by a similar magnitude (~20%) as observed in the CFD-to-tunnel comparison. This consistency across multiple reference standards suggests the presence of a systematic scaling factor rather than random measurement error and that this effect is related to the tunnel testing.
Additional validation
Additional validation was conducted against proprietary data that cannot be publicly disclosed due to confidentiality agreements. These supplementary tests, which included 3D scans, wind tunnel tests and CFD simulations of athletes, with, and without bike showed consistent performance patterns with the publicly presented results above. The mean variance observed across these proprietary datasets was within similar ranges to those reported in the Wind Tunnel Benchmarking section, but with substantially lower systematic scaling difference of around 5%. While detailed results cannot be shared, these additional validations further support the tool's reliability across a broader range of conditions."
Conclusions and Discussion
Based on our research and data provided, AiRO can be used to discern between different positions with similar accuracy as experienced wind tunnel testers. As computers continue to become faster and calculation approaches continue to improve, the simulation accuracy is also expected to improve further. The scaling difference between our tunnel testing and CFD is unexplained and will be investigated further to increase the confidence in the reporting of absolute CdA values, but the strong linear relationship and high correlation still implies a valid test.
This validation paper focused on the statistical aspects of validation when used as intended. The design decision and underlying technologies used for AiRO dictate limitations of what currently can be simulated. Notably, AiRO can not account for varying skinsuit roughness, fabric seems, textile wrinkles or hair. For a complete and updated list of limitations please consult the limitations section on our website.
We will continue researching and publishing validation reports as we pursue our mission to bring accurate, affordable and easy to use aero testing to our customers.
Limitations
For any precision tool you should know what it can and can’t do. We tell you.
Last Updated: 4/3/2024
At our core, we are a measurement company. No measurement tool is perfect, but you can expect from the toolmaker to be clear of what it can and can not do.
Below we keep a regularly updated list of our known limitations. As we find additional information or improve approaches, we will edit this list. If you experience or are aware of issues not listed here, please reach out to support@airo.app. We have grouped them by category.
Digital Aero Twin
Limited support for para athletes: AiROs sister company, Inspire Gold is proud to consult with multiple paralympic champions and athletes. The way our Digital Aero Twin works, we currently do not natively support the creation of Digital Twins with missing limbs, significant limb length discrepancies, or atypical ranges of motion.
Body shapes not represented in our training data: AiROs Digital Twin is trained on a dataset of thousands of 3D scans of people from the general population. The more an athlete’s morphology diverges from the scans represented in the data set, the harder it is for our technology to build a representative model. We have found challenges building twins of champion body builders and cyclists with a very pronounced difference in lower to upper body musculature. Unfortunately, our dataset also contained limited scans of highly trained competitive female cyclists. We are planning to collect a more representative training data set in the future.
Stomach flex and breathing: Most people contract their stomach muscle when someone takes a picture of them. When on the bike in cycling pose, some riders also flex their stomach muscles, while some riders relax their stomach muscles. Chest and waist diameter changes substantially during a breathing cycle. While those settings are fine-tuneable in Digital Aero Twin Settings, we made the choice not to add a breathing slider to the Position Editor.
Limited foot range of motion: To not complicate position adjustments and allow us and our customers to focus on upper body changes our foot currently does not angulate as part of the pedal stroke. However, this means for some bike positions and for riders with strong foot angulations we don’t fit foot poses well. We also don’t allow for cleat adjustment on the foot (also done to retain simplicity). We will look to find a better solution that retains ease of use, while fitting to more foot parameters.
No wrist degrees of freedom: We are aware triathletes and time trialists care about their hand positions and extension choice. We decided to keep the number of sliders to less than 20 for the initial version. We plan to roll out a different menu with “advanced settings” so we can serve customers that want a simple UI and those that want full functionality.
Digital Aero Twin does not wear shoes: We do not expect a shoed version of to lead to different fit or helmet recommendations, so we have not prioritized this feature. Let us know if this is an issue somehow.
No clear definition of saddle setback: Since we only simulate the rider, there is no saddle. There are different saddles, and people sit different on different saddles, so our saddle setback is an approximate of a typical saddle.
Helmets
No through flow: As we are focused on drag right now and aim to provide fast and affordable calculations, we decided not to mesh the internal vent structures for now and not simulated through flow through the helmet. Results are most representative for people with curly or significant hair that blocks the internal vent structures.
Only one helmet size:
Of the helmets we have that come in different sizes we currently only have one size in the app. We are considering expanding to different helmet sizes in the future, once our user interface allows to keep that all well managed.
No helmet straps or fit system:
Our 3D scans do not include helmet straps or fit systems.
Other Equipment
No bike: We chose to simulate the poses without a bike and report the CdA and power values with a fixed offset accounting for bike CdA. You can set bike CdA offset in settings. We made that decision since adding a bike would have tripled simulation time and cost, while not having significant effect on pose recommendations. We confirmed this through spot tests of position recommendations generated from simulations with and without bikes.
No skinsuit / aerosocks: Our Digital Aero Twin is as a uniform smooth texture. We do not account for clothing wrinkles, seams or textured fabric. The results are most representative of an athlete wearing a smooth skinsuit or traveling at pre-transition speeds of the skinsuit. High performance skinsuits can reduce the drag of the upper arms so for athletes wearing those skinsuits we estimate our simulations overpredict the drag and of the arms. The same applies to aero socks.
CFD
Straight head wind only (for now): All simulations on AiRO happen with a straight head wind. In the future you will be able to choose from zero degree only, or a yaw sweep, where the yaw sweep will have to cost additionally, since it increases the amount of simulations five or seven-fold. From our experience, differences between helmets or positions at zero-degree yaw are highly corelated to the differences at five degrees. At ten and fifteen degrees the differences are starting to diverge more, but those yaw angles are a small fraction of the total yaw distribution, outside of explicitly windy races.
One wind speed only: To accurately model the effects of different wind speeds on our positions we would need a transition model, a way to user specify surface textures and a wind speed model. While we plan to add transition models in the future, we decided to prioritize easy of use and minimal settings, and using a turbulence modelling approach that has significant academic validation.
No transition model: We are using the k-omega SST turbulence model since it is the defacto standard for sports aerodynamics and has shown to accurately simulate differences in body position in multiple peer reviewed academic papers. There are now approaches to add a transition model, and two papers have shown promising increases in accuracy. Our current validation work was done without a transition model, and we are content with the results, so we will wait until us and academia can validate the accuracy and robustness of the transition models further before switching. Our goal was to be able to offer simulations for less than $10 and around five minutes, and we felt the additional cost and time of a transitional model was not offset by the small increase in accuracy.
Not pedaling: in our default simulation mode our avatar is not pedaling. When running simulations, AiRO automatically places the legs at a crank angle of 30 degrees, which in multiple published studies has shown to be the static angle that most represents pedaling. We can approximate pedaling closer by averaging four crank position, but this is currently not a released feature, since it would increase the cost per simulation by a factor of four. If there is interest among our customers, we can release this model.
Our Approach
We share our values with you, so you can understand how we make our decisions, and if AiRO is a fit for you.
When developing AiRO we have to make dozens of decisions each day. For many decisions there is no right or wrong answer, but more a decision on what you want company we want to be. Here, we share our values with you, so you can understand how we make our decisions, and if AiRO is a fit for you.
What we want to be:
Useful – We succeed when our users are faster on race day because of us.
Easy to use – Current aero testing approaches are too complex. We want to offer a simpler alternative.
Affordable - The fastest aero position is yet to be found, there is an infinite number of possibilities to explore. The more affordable we are, the more our customers can test, and the more riders we can reach.
Accurate – Our goal is to help you be faster on race day, not just in a simulation.
Continuously improving: Learn and iterate – This is just the beginning of AiRO. Computers will get faster and science will progress. There is more to come and a lot left to learn.
Priorities are especially important if some goals conflict with each other. Here are a couple examples:
We could make AiRO more accurate by requiring more pictures and body measurements from our customers, but this would increase the barrier of entry. Through testing we determined the smallest number of inputs we can use to give accurate aero information, and for the more detail-oriented riders we offer to fine tune their Digital Aero Twin with additional measurements.
CFD simulations tend to become more accurate as the cell count increases and there are potentially more accurate approaches to model turbulence than what we employ. We chose an approach allowed to turn around simulations in around five minutes and for $10 or less while validating in the wind tunnel that we can capture the aerodynamic effect of most pose or helmet changes accurately. (Read more in our benchmarking reports.)
We allow our users to adjust aspects of their position with sliders. Currently, we have 18 adjustments you can make and we believe this captures most pose changes our riders are looking for. We are trying to strike a trade off between enabling our riders full control, while not being overwhelming to new users.
Five years ago, when I ran CFD for a large bike company, the kind of simulations we run today would have taken hours and cost more than $100. Computers keep getting faster every year, science progresses and we will learn from our users feedback.
We have released AiRO as a commercial product because we believe it meets our bar for being useful. We are excited to provide the ability to get aerodynamic feedback 10x cheaper and faster than tunnel testing and we know you can use AiRO to go faster come race day – our very first client won the world championship for the first time after we used AiRO to help them. But that does not mean AiRO is perfect. We believe we can continue to make AiRO easier to use, more accurate, and enable more use cases. AiRO is developed by people that can err, make mistakes and wrong decisions. We look forward to being in open conversation with our users to learn how we can improve and we aim to admit mistakes.
Where we know of current limitations we will document them on our Limitations page. No measurement tool is perfect, but you should expect the tool makers to be open about what it can and can’t do.
A culture of continuous improvements provides a challenge for measurement companies: New versions of AiRO will provide results that are more accurate than old versions, but that means the results will also be different. This means that simulations with a new approach might not be comparable to simulations with an old approach. We are aware that our customers invest money in their testing library, and want to continue comparing to old results, and not start from scratch at every update. We intend to roll out improvements to accuracy thoughtfully and in a way that maximizes the value to our customers.
We are thankful you are on this journey with us and we can’t wait to make you faster.
Ingmar Jungnickel, Founder AiRO